
Key Takeaways:
-
Ondo (ONDO) is trading near a critical support zone around $0.32 after a sharp market-wide sell-off.
-
The daily chart shows a right-angled descending broadening wedge, a pattern often linked to potential bullish reversals.
-
Buyers are defending the lower wedge boundary, suggesting selling pressure may be weakening.
-
The 100-day moving average near $0.53 remains a major resistance that must be reclaimed for trend reversal confirmation.
-
A successful rebound could open the door for a recovery toward the $1.10–$1.17 resistance zone, while a breakdown below $0.32 would invalidate the bullish setup.
The real-world asset (RWA) token Ondo (ONDO) is trading under pressure near $0.35, extending its short-term downtrend amid a broader crypto market sell-off. The latest wave of weakness follows escalating US–EU trade tensions, which sparked over $851 million in long liquidations, dragging major assets like Bitcoin (BTC) and Ethereum (ETH) down by roughly 2.5% and 4.5%, respectively, over the past 24 hours.
ONDO itself is down 5.98% at the time of writing. However, despite the bearish momentum, the daily chart suggests price is approaching a technically important zone where a potential rebound setup could begin to form.
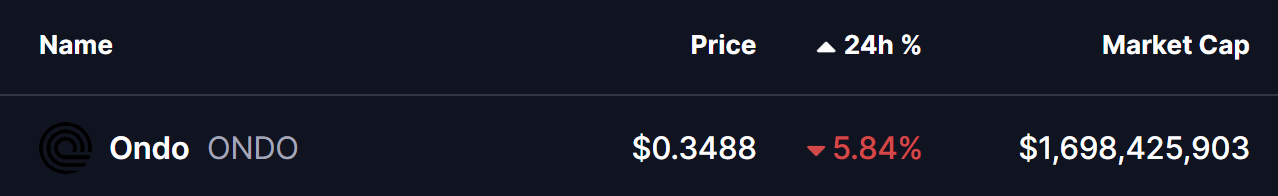
Source: Coinmarketcap
Right-Angled Descending Broadening Wedge in Focus
From a technical perspective, Ondo’s daily chart is carving out a right-angled descending broadening wedge, a pattern that often appears during extended corrective phases and can precede bullish reversals if support holds.
This structure has been developing since ONDO’s rejection from the neckline resistance zone around $1.00–$1.17 back in September 2025. Since then, price has continued to print lower highs while gradually expanding volatility, pushing ONDO down toward the lower boundary of the wedge near $0.32.
Notably, selling pressure appears to be easing near this zone. Buyers have stepped in to defend the level, with ONDO currently hovering slightly above it around $0.348 — a sign that demand may be emerging after weeks of sustained downside.
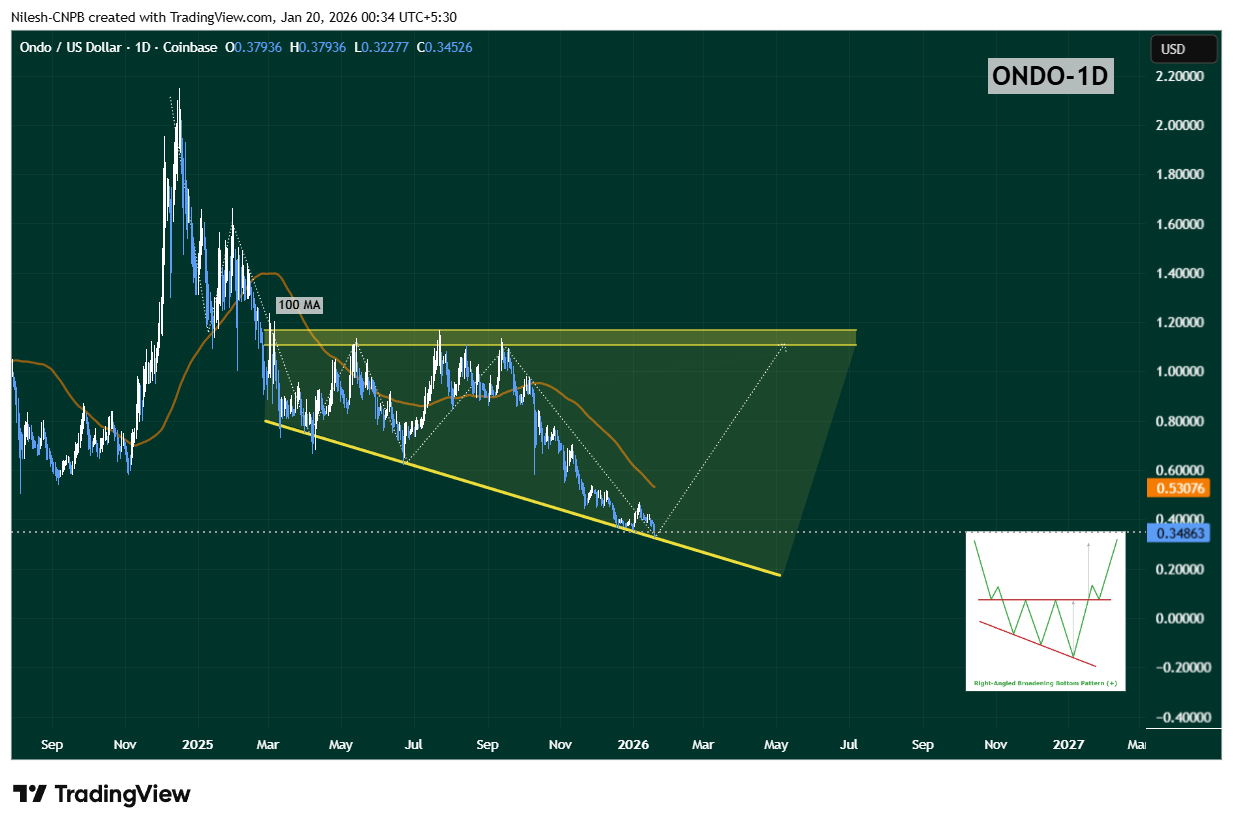
Ondo (ONDO) Daily Chart/Coinsprobe (Source: Tradingview)
While the lower wedge support is holding for now, upside momentum remains constrained. The 100-day moving average, currently positioned near $0.53, has flipped into strong overhead resistance. Each prior rally attempt has stalled below this level, reinforcing its importance as a confirmation point for any meaningful trend reversal.
Until ONDO can reclaim this moving average, any bounce should be viewed as a relief rally within a broader consolidation, rather than a confirmed rebound.
What’s Next for ONDO?
As long as ONDO continues to defend the $0.32 support zone, the right-angled descending broadening wedge remains technically valid. Sustained holding above this level keeps the door open for a rebound attempt, particularly if price begins forming higher daily or weekly closes.
A successful reclaim of the 50-day moving average, followed by a breakout above the 100-day MA, would mark a clear shift in momentum. If that scenario unfolds, ONDO could gradually work its way back toward the upper boundary of the wedge, which currently aligns near the $1.10–$1.17 region — a level that would represent a significant recovery from current prices.
On the flip side, a decisive breakdown below $0.32 would invalidate the bullish wedge structure and likely expose ONDO to another leg of downside or prolonged consolidation.
Bottom Line
Ondo is currently sitting at a critical technical crossroads. While broader market sentiment remains fragile, the chart suggests ONDO is testing a zone where seller exhaustion could give way to a bounce. The next few sessions will be crucial. How price reacts around the lower wedge support will likely determine whether ONDO can stage a meaningful rebound — or whether bears retain control for longer.
Disclaimer: The views and analysis presented in this article are for informational purposes only and reflect the author’s perspective, not financial advice. Technical patterns and indicators discussed are subject to market volatility and may or may not yield the anticipated results. Investors are advised to exercise caution, conduct independent research, and make decisions aligned with their individual risk tolerance.
About Author: Nilesh Hembade is the Founder and Lead Author of Coinsprobe, with over 5 years of experience in the cryptocurrency and blockchain industry. Since launching Coinsprobe in 2023, he has been providing daily, research-driven insights through in-depth market analysis, on-chain data, and technical research.
Disclaimer: The information on this page may come from third parties and does not represent the views or opinions of Gate. The content displayed on this page is for reference only and does not constitute any financial, investment, or legal advice. Gate does not guarantee the accuracy or completeness of the information and shall not be liable for any losses arising from the use of this information. Virtual asset investments carry high risks and are subject to significant price volatility. You may lose all of your invested principal. Please fully understand the relevant risks and make prudent decisions based on your own financial situation and risk tolerance. For details, please refer to
Disclaimer.
Related Articles
Ethereum Breakout Signals Short-Term Upside
The recent bullish sentiment in the crypto market is driven by Ethereum's breakout from a downward trendline, indicating potential price targets of $2,050 and $2,085. While the volatility remains, analysts are optimistic about Ethereum's long-term prospects contingent on market adoption.
Coinfomania6m ago
SXP Price Surges 11.59%: What This Could Mean for Traders
SXP has surged 11.59% amid a generally declining crypto market, reaching $0.0231. This increase reflects heightened investor interest, driven by market dynamics and trading activity, as traders eye key resistance and support levels.
Coinfomania16m ago
BitMine increased its holdings by 60,976 ETH last week. The Executive Chairman states that ETH may bottom out in mid-month.
BitMine announced that as of March 8, its total assets reached $10.3 billion, including 4,534,563 ETH and 195 BTC. Executive Chairman Tom Lee stated that amidst market uncertainty, ETH has shown resilience, and its price is expected to bottom out between March 8 and 14. Meanwhile, BitMine is accelerating its ETH accumulation, with staked ETH reaching 3,040,483.
GateNews22m ago
Oil prices rise to $119, reaching a new high since 2022, Bitcoin remains at $67,000, and the Federal Reserve has a 99% probability of maintaining interest rates in March.
On March 9th, WTI crude oil prices rose to $119 per barrel, reaching a new high since 2022. Due to threats from Iran, global crude oil supply losses approached 20 million barrels. Bitcoin remained at $67,000, with no signs of panic selling. The probability that the Federal Reserve will keep interest rates unchanged is approximately 99%.
GateNews55m ago
Bitcoin order book data: Over $100 million in buy orders accumulated in the $65,000 range, with sell pressure around $68,000.
Gate News Report, March 9 — On the X platform, on-chain data analysis platform Coinglass released data showing that Bitcoin order books have accumulated buy orders exceeding $100 million in the $65,000 to $65,150 range. Meanwhile, order book data indicates significant sell pressure around the $68,000 level.
GateNews57m ago
Bitcoin short-term holder SOPR indicator was below 1.0 for 7 out of 8 days, with a supply decrease of 140,000 coins over two weeks.
The report shows that the SOPR indicator for short-term Bitcoin holders has been below 1 for 7 out of the past 8 days, indicating they are selling below cost. Additionally, the supply has decreased to 5.92 million BTC, reflecting realized losses or a shift to long-term holding.
GateNews1h ago