Midnight (NIGHT), Pump.fun (PUMP), and Bittensor (TAO) are becoming the focus of the sell-off wave as they lead the decline in the past 24 hours, amid a generally weakening cryptocurrency market. Increasing selling pressure right before the holiday season is causing these altcoins to face the risk of further decline and expanding correction margins in the short term.
Midnight falls freely, may break important support line
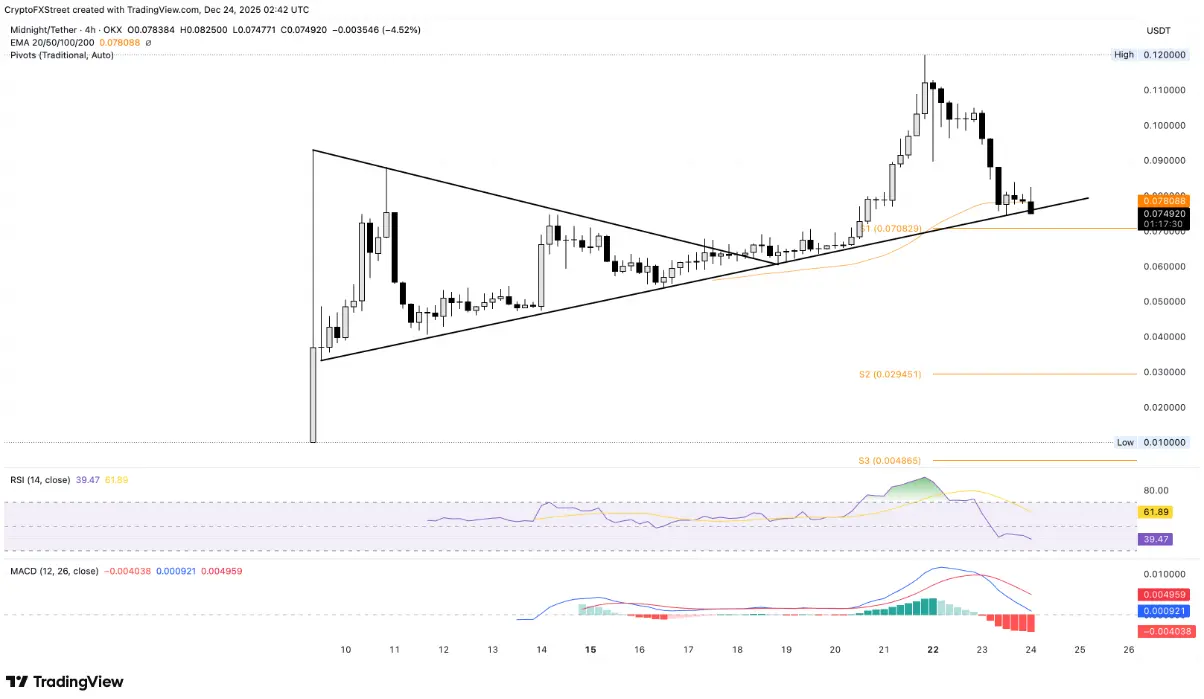
Midnight continues to face strong selling pressure, dropping more than 3% during Wednesday’s trading session, extending the 24% plunge from the previous session. A three-session decline since NIGHT peaked at $0.1200 on Sunday has caused the price to evaporate about 33% in just a few days, placing this coin among the most weakened assets of the week.
On the 4-hour chart, the privacy-focused sidechain of the Cardano ecosystem is approaching the short-term support break level, formed from the lows on 16 and 18/12, around $0.07500. A clear closing candle below this level could trigger the next wave of selling, pushing the price back to the S1 Pivot at $0.07000, or even deeper into the psychological support zone at $0.05000.
 Night/USDT 4-hour chart | Source: TradingView
Technical signals on the 4-hour timeframe continue to favor the bears. The RSI index has fallen to 39 and is approaching the oversold zone, reflecting a clear weakening momentum. Meanwhile, the MACD has crossed below the signal line, with the negative histogram bars gradually expanding, indicating increasing downward pressure.
Night/USDT 4-hour chart | Source: TradingView
Technical signals on the 4-hour timeframe continue to favor the bears. The RSI index has fallen to 39 and is approaching the oversold zone, reflecting a clear weakening momentum. Meanwhile, the MACD has crossed below the signal line, with the negative histogram bars gradually expanding, indicating increasing downward pressure.
In a more optimistic scenario, if the price can bounce from the $0.07000 zone, NIGHT needs to quickly regain and stay above the 50-period EMA at $0.07808 to weaken the current downtrend and open short-term recovery opportunities.
Pump.fun targets a decline to $0.001000
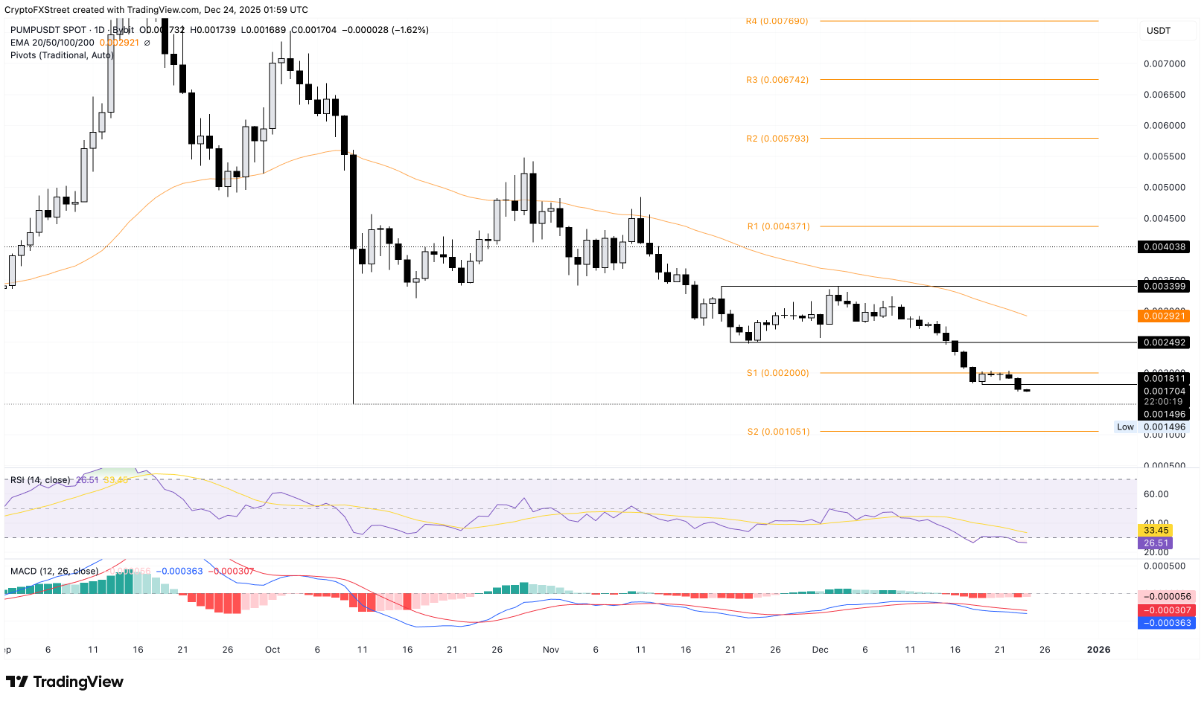
Pump.fun continues to face strong selling pressure as it maintains a downtrend below the psychological threshold of $0.002000, after losing another 3% on Monday. At the time of writing, PUMP is down about 2% on Wednesday, marking a third consecutive decline and indicating that the weakening momentum has not yet stopped.
Technically, the nearest support zone for this token is at the October 10 low around $0.001496. If this level is broken, selling pressure could push the price further down to the S2 Pivot at $0.001051.
 PUMP/USDT daily chart | Source: TradingView
Momentum indicators continue to signal negative. The RSI remains at 26, deep in the oversold zone and moving sideways, reflecting dominant selling pressure. At the same time, the MACD and signal line are both trending downward, further reinforcing the short-term weakening scenario.
PUMP/USDT daily chart | Source: TradingView
Momentum indicators continue to signal negative. The RSI remains at 26, deep in the oversold zone and moving sideways, reflecting dominant selling pressure. At the same time, the MACD and signal line are both trending downward, further reinforcing the short-term weakening scenario.
To open up reversal opportunities and restore an uptrend, PUMP needs to quickly regain and hold above the $0.002000 level – an important psychological threshold that influences market confidence.
Bittensor faces pressure, at risk of losing the $200 mark
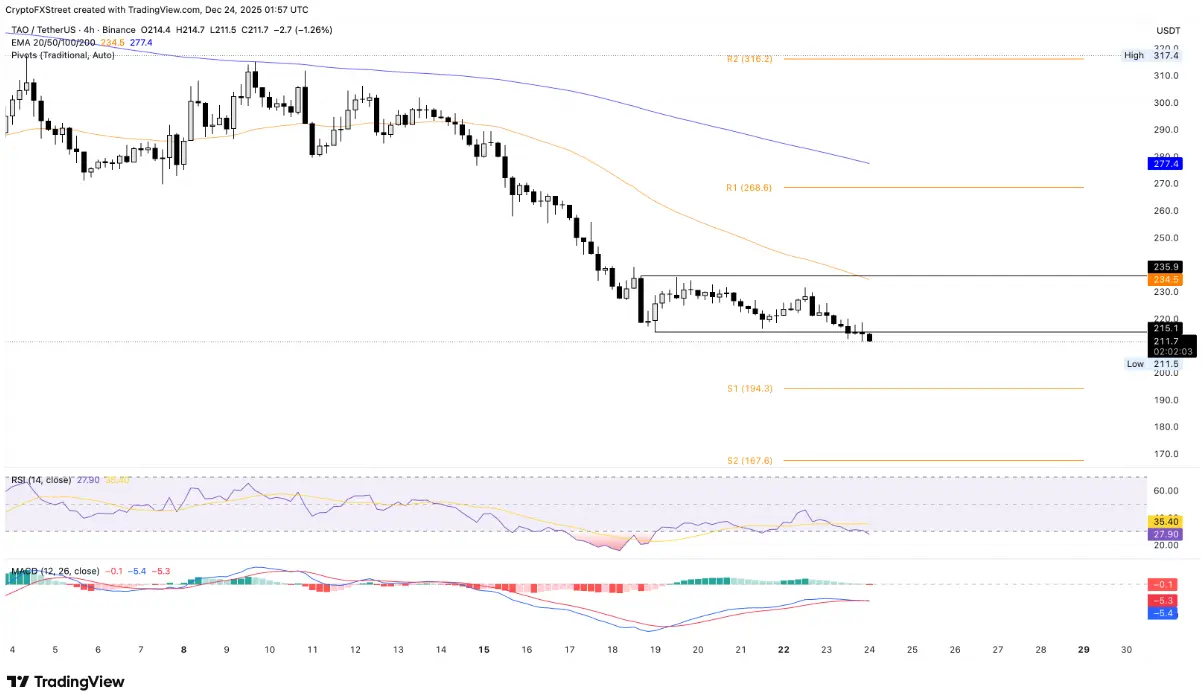
Bittensor (TAO) is approaching the critical psychological level of $200 after losing the short-term support zone at $215 — the price coinciding with the Friday session low. This development puts TAO at risk of breaking below $200, opening the possibility of testing the S1 Pivot around $194.
In a more negative scenario, if the price closes below the $194 zone, selling pressure could intensify, pushing TAO down to the S2 Pivot at $167, indicating an extended correction.
 TAO/USDT 4-hour chart | Source: TradingView
From a technical perspective, RSI is currently at 27, having fallen into the oversold zone after reversing from near the weekly midpoint last week, indicating selling pressure is returning to the market. Additionally, the MACD is converging with the signal line, increasing the risk of a bearish crossover — a factor that could trigger a new wave of decline.
TAO/USDT 4-hour chart | Source: TradingView
From a technical perspective, RSI is currently at 27, having fallen into the oversold zone after reversing from near the weekly midpoint last week, indicating selling pressure is returning to the market. Additionally, the MACD is converging with the signal line, increasing the risk of a bearish crossover — a factor that could trigger a new wave of decline.
Conversely, if TAO maintains above $200 and buying interest appears, the price could recover to test the 50-period EMA, which is trending downward around $234, likely serving as a significant resistance zone.
Disclaimer: The information on this page may come from third parties and does not represent the views or opinions of Gate. The content displayed on this page is for reference only and does not constitute any financial, investment, or legal advice. Gate does not guarantee the accuracy or completeness of the information and shall not be liable for any losses arising from the use of this information. Virtual asset investments carry high risks and are subject to significant price volatility. You may lose all of your invested principal. Please fully understand the relevant risks and make prudent decisions based on your own financial situation and risk tolerance. For details, please refer to
Disclaimer.
Related Articles
Bitcoin Shows Value Bottom Signals but True Market Floor Missing
Bitcoin is at a "Value Bottom" ideal for long-term dollar-cost averaging, but has not yet reached a "Structural Bottom," leading to projected volatility between $60K-$70K. Investors should prepare for continued fluctuations and potential buying opportunities.
BlockChainReporter46m ago
Bitcoin Trades Narrow Range As Resistance Holds Near $71K
Bitcoin is trading around $70,335, showing a 2.13% decline in 24 hours. Analysts note a resistance near $71,400 and a consolidation phase, with traders awaiting a decisive breakout above or below established support and resistance levels.
CryptoBreaking55m ago
BTC 15-minute rise of 0.60%: ETF capital inflows and technical breakout resonance drive short-term momentum
2026-03-13 12:45 to 2026-03-13 13:00 (UTC), BTC achieved a +0.60% return within 15 minutes, with a price range of 72341.6-72888.0 USDT and a volatility amplitude of 0.76%. Short-term price oscillations noticeably intensified. Due to abundant trading volume, market attention rose rapidly, reflecting a phase of strengthened buying power.
The primary drivers of this movement are continuous net inflows into ETFs and a technical breakout of key structures. In March 2026, BTC spot ETFs attracted capital inflows as high as 1.6 billion dollars in a single week.
GateNews1h ago
DeFi enters a "winter of yields": liquidity stagnation, leverage contraction, and the disappearance of arbitrage opportunities
The DeFi market entered an "interest rate winter" since September 2025, with deposit rates for major stablecoins declining sharply and supply-demand imbalances causing liquidity congestion. The rate decline reflects reduced capital demand and a lack of high-return opportunities. Stablecoin lending demand has dropped significantly, with market risk appetite shifting toward more stable investment channels. In response to this situation, the Sky protocol demonstrates competitiveness and adaptability by introducing real-world assets to enhance yields. The low interest rates during this phase can be viewed as an opportunity for DeFi market transformation.
区块客1h ago
"Seeking a Sword by Marking a Boat" - Style Coin Price Predictions Go Viral: The Practical Logic and Flaws of Mystical Prophecies
Author: Frank, PANews
Whenever the market enters a confusing phase of going nowhere, people try to use a "cutting the boat to seek the sword" method of historical retrospection to predict the next market movement. In such cases, people often see from these theories and charts that history always repeats itself, and seem to automatically overlay and verify future price movements with a certain period in the past.
This coincidence seems to have a magical effect and is often verified. Some bloggers claim this prediction method has an accuracy rate of 75%~80%.
Does this "cutting the boat to seek the sword" style price prediction that repeatedly goes viral on social media help the market identify stages, or is it just packaging noise as prophecy?
From "Tick Fractals" to "History Rhyming"
The peak operation regarding predictions of October 2025 market tops is an analyst named CryptoBullet, who created a method called "ti
区块客1h ago