Bitcoin (BTC), Ethereum (ETH), and Ripple (XRP) are signaling a potential breakout on Friday after recording impressive weekly gains of over 8%, 10%, and 4%, respectively. Currently, BTC and ETH are approaching key technical levels—markers that could determine the market’s next direction. Meanwhile, XRP remains in accumulation mode, moving steadily within a descending channel. If major resistance levels are decisively broken, these top three cryptocurrencies could see a new wave of surge.
Bitcoin Could Extend Gains if It Closes Above the 50-Day EMA
Bitcoin is trading around $71,600 on Friday as the market shows signs of cautious recovery. This upward move brings the price close to the upper boundary of a parallel channel, which has contained Bitcoin’s volatility for several weeks within the $65,900–$72,600 range. A decisive breakout above this resistance zone could mark the end of the short-term correction and open room for a new rally.
However, the overall technical picture remains somewhat bearish. The daily closing price is still below the 50-day and 100-day EMAs, which are currently clustered near the lower end of the $70,000 zone, indicating ongoing resistance from above. Nonetheless, a strong breakout could significantly improve short-term momentum.
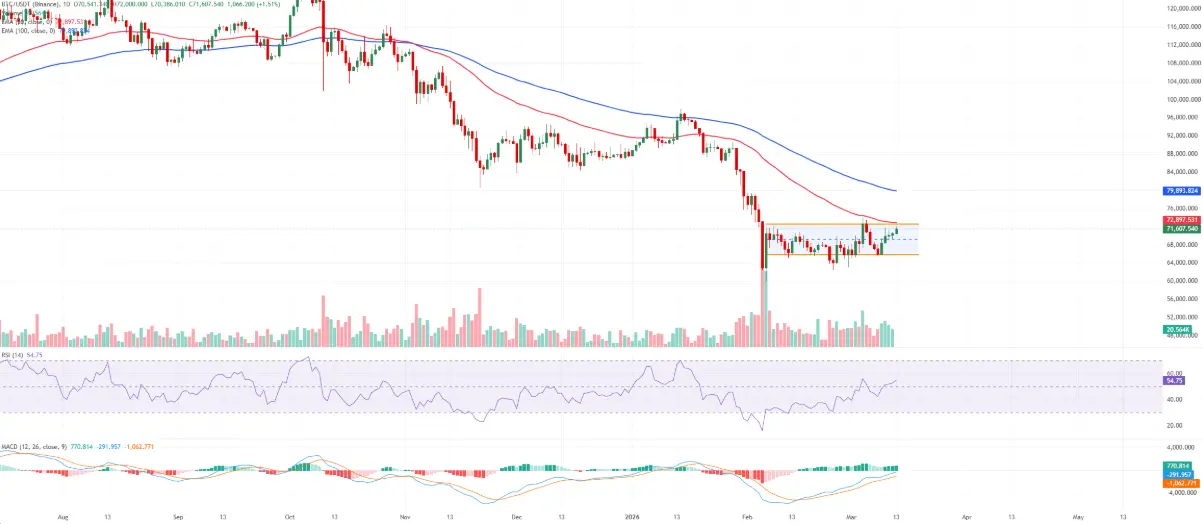 Daily BTC/USDT Chart | Source: TradingView Momentum indicators are gradually turning positive. The daily RSI has recovered to 54, crossing above the neutral threshold, suggesting buying pressure is improving. At the same time, the MACD remains in positive territory, with the MACD line above the signal line and a slight positive histogram—confirming a recovery trend is forming.
Key technical levels include the $68,800 support, corresponding to the middle of the channel, which is the nearest support level. If Bitcoin maintains above this level, the short-term bullish structure remains intact. If selling pressure increases, next supports are at $66,000 and $65,900, the channel’s near-term lows.
On the upside, the first resistance is at $72,600, just below the 50-day EMA around $72,900. If Bitcoin can close firmly above this level, the next target would be the 100-day EMA near $79,900, potentially paving the way for more sustainable growth.
Ethereum Approaching the Upper Boundary of Its Price Channel
Ethereum is trading around $2,120 on Friday after bouncing from support at the midline of its parallel channel earlier this week. The short-term outlook is slightly positive as the price continues testing the channel’s upper boundary, with recent candles staying just below $2,148, indicating buying interest is persisting near this resistance.
From a technical perspective, the 50-day and 100-day EMAs remain above the current price and are trending downward, reflecting a mid-term correction. However, momentum signals are improving: the RSI has risen to around 54, indicating a recovery from oversold conditions. Meanwhile, the MACD remains above the signal line in positive territory, with a slight positive histogram, suggesting bulls still hold some advantage despite the overall correction.
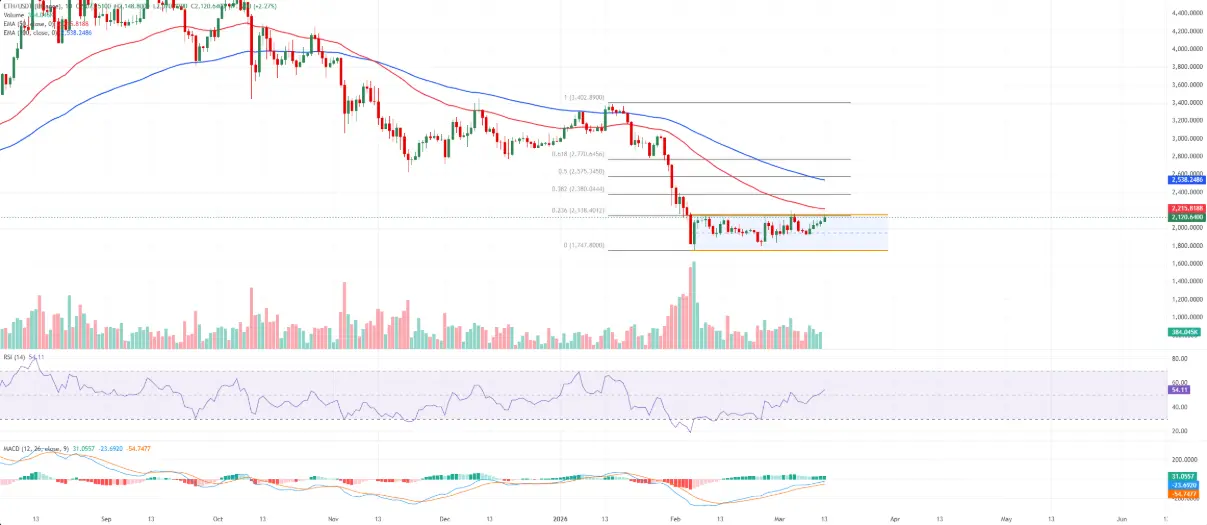 Daily ETH/USDT Chart | Source: TradingView The immediate resistance is at $2,148, the channel’s peak. Just below this is the 23.6% Fibonacci retracement level of the decline from $3,402 to $1,747 at $2,138, which has recently acted as a resistance. A decisive daily close above this confluence could open the door to the 38.2% Fibonacci level at $2,380.
On the support side, $2,000 remains a key psychological level in the short term, followed by recent lows around $1,940. Breaking below this zone could increase selling pressure, pushing the price back toward the channel’s lows and possibly retesting the strong support around $1,747.80, the origin of the previous correction.
XRP Trading Within a Descending Parallel Channel
XRP is currently trading near $1.40, up about 4% over the week. However, the price remains within a descending channel formed from over $2.80, indicating that the short-term trend is still bearish. A positive note is that XRP has recently stabilized above $1.35, helping the market balance after the correction.
From a technical standpoint, XRP remains below the 50-day and 100-day EMAs (around $1.51–$1.72). These moving averages continue to act as dynamic resistance zones, implying that recent gains are likely just a rebound within a larger downtrend.
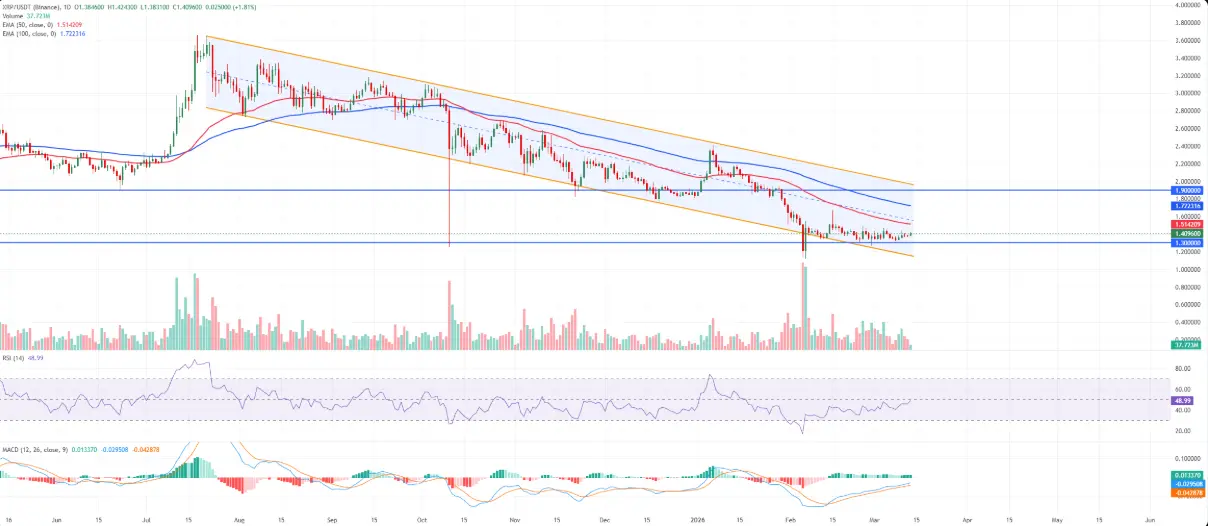 Daily XRP/USDT Chart | Source: TradingView The RSI is at 49, approaching neutral, indicating selling pressure is waning. Meanwhile, the MACD has only slightly crossed above the signal line, reflecting cautious buying during this correction phase.
Support levels include $1.30, which coincides with the recent accumulation lows and remains above the channel’s bottom around $1.15. A daily close below $1.30 would increase the risk of a deeper decline toward the channel’s lows and possibly retesting the strong support at approximately $1.747.80, the start of the previous major correction.
To improve bullish prospects, XRP needs to break above the nearest resistance at the 50-day EMA near $1.51, then challenge the 100-day EMA around $1.72. Sustained movement above these levels could open the path toward the channel’s downward peak near $1.97. However, failure to surpass $1.51 may result in continued downward pressure and limited recovery attempts.
Disclaimer: The information on this page may come from third parties and does not represent the views or opinions of Gate. The content displayed on this page is for reference only and does not constitute any financial, investment, or legal advice. Gate does not guarantee the accuracy or completeness of the information and shall not be liable for any losses arising from the use of this information. Virtual asset investments carry high risks and are subject to significant price volatility. You may lose all of your invested principal. Please fully understand the relevant risks and make prudent decisions based on your own financial situation and risk tolerance. For details, please refer to
Disclaimer.