
The Aster price has been stuck in a tight range for weeks, but that quiet period may not last much longer.
Top analyst Ardi pointed out that the token is in its longest consolidation phase ever. In fact, the chart shows that the token has been trading sideways for close to three weeks.
Instead of the token trading up or down, it has been trading in a tight range, repeatedly testing support without breaking it. At writing, the ASTER token is trading at around $0.71.
Here’s What The ASTER Chart Is Showing
The chart shared by trader Ardi shows that ASTER has been defending a key support area around $0.69–$0.70. Several quick dips into that zone were immediately bought up, which suggests buyers are still active at those levels.
Another detail standing out in the ASTER chart is declining trading volume during the consolidation. That type of behavior often appears when markets are quietly building positions before the next move.
Instead of aggressive buying or selling, traders appear to be waiting. According to the analyst, that combination of stable support and shrinking volume can signal a local accumulation phase.
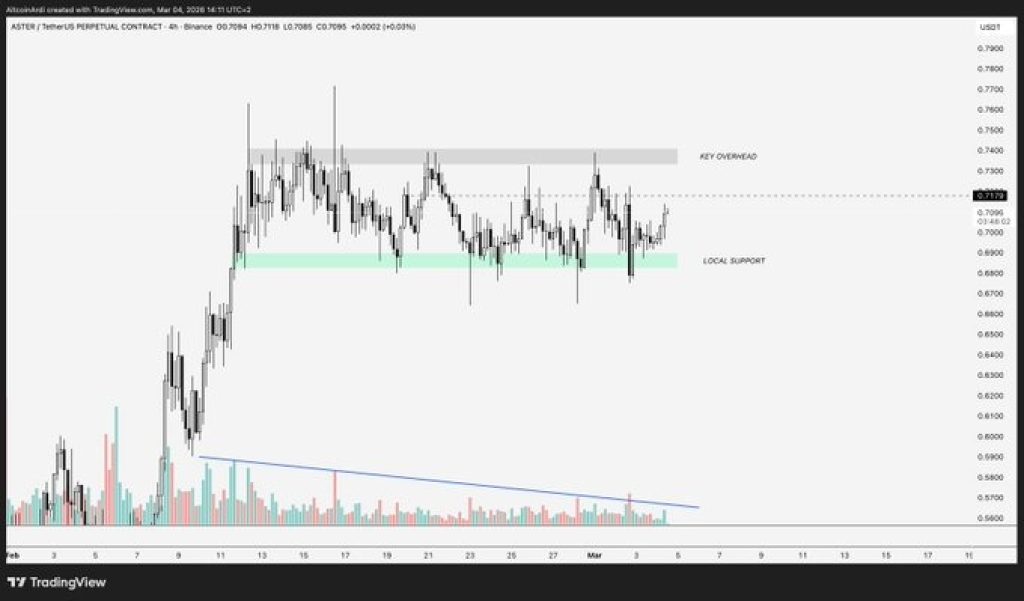
Source: X/Ardi
However, on the upside, the most important level sits around $0.75.That area has acted as a ceiling multiple times during the past few weeks, stopping each rally attempt before it could extend higher.
If the ASTER price manages to break above that level with strong momentum, the next target could come near $0.81, which the analyst describes as a larger macro pivot on the chart.
A move into that region would mark a clear shift in market structure after weeks of sideways action.
_****Pi Coin Price Prediction As Pi Network Prepares Major Upgrade Ahead Of Pi Day**
What’s Next For ASTER?
However, the setup cuts both ways. The longer a market stays trapped in a tight range, the more pressure tends to build. When the breakout finally happens, the move often happens quickly.
If the ASTER price fails to hold the $0.69 support zone, the analyst warns that the downside reaction could be sharp. After weeks of buyers entering the same area, a breakdown could push many of those positions underwater at the same time.
Such a situation may lead to forced selling and drive prices lower.For now, ASTER price remains stuck in a tight range between $0.69-$0.70 support and $0.75 resistance. We’re waiting to see which level will be broken first. Because after three weeks of silence, the next move may not stay quiet for long.
Disclaimer: The information on this page may come from third parties and does not represent the views or opinions of Gate. The content displayed on this page is for reference only and does not constitute any financial, investment, or legal advice. Gate does not guarantee the accuracy or completeness of the information and shall not be liable for any losses arising from the use of this information. Virtual asset investments carry high risks and are subject to significant price volatility. You may lose all of your invested principal. Please fully understand the relevant risks and make prudent decisions based on your own financial situation and risk tolerance. For details, please refer to
Disclaimer.
Related Articles
BTC short-term decline of 0.76%: key price levels encountering resistance and long leverage liquidations triggering market sell-off
On March 5, 2026, from 14:30 to 14:45 (UTC), Bitcoin (BTC) experienced a short-term decline, with a return of -0.76%. The price ranged between 71,958.3 and 72,830.0 USDT, with an amplitude of 1.20%. Market attention significantly increased, and during the event window, trading volume expanded, volatility intensified, and price anomalies attracted many investors' focus on short-term risks and future trends.
The main driver of this anomaly was BTC encountering resistance in the key price zone of $73,750–$74,400. Historical data shows that this zone has repeatedly acted as a...
GateNews9m ago
Bitcoin: Real-Time Sentiment Gauge for Weekend Warmongering
The article analyzes Bitcoin's real-time sentiment as a gauge during weekend market fluctuations, emphasizing its role in reflecting broader economic trends and investor behavior in the crypto landscape.
CryptoBreaking11m ago
Ripple CTO Emeritus Shares Candid Truth about XRP and Crypto Market - U.Today
David Schwartz, former Ripple CTO, expressed mixed feelings about XRP's performance, reflecting broader crypto market sentiment. Despite recent struggles for altcoins, XRP showed signs of a potential recovery with a newly formed "golden cross" on its price chart, although market conditions remain cautious.
UToday36m ago
When the Asia-Pacific stock markets hit the circuit breaker, why does Bitcoin stand out as the best?
Author: Jae, PANews
On March 4th, as the situation in the Middle East suddenly worsened, global financial markets instantly entered a "wartime state." For global investors, this was a trading day worthy of being recorded in history.
Disruption of shipping through the Strait of Hormuz, a critical energy choke point, triggered a sharp surge in international oil prices. Panic quickly swept through traditional capital markets, and Asia-Pacific stock markets experienced an epic sell-off.
KOSPI in South Korea plummeted 12% in a single day, marking the largest decline in history; the Nikkei 225 dropped 3.7%, its worst performance in five months; Middle Eastern local stock markets once tumbled nearly 5% amid a correction; major European and American stock indices closed lower across the board.
However, an unusual phenomenon quietly emerged amid this sell-off.
The crypto market, often regarded as "high risk, high volatility," which tends to be the first asset class to collapse during any geopolitical crisis, surprisingly held steady this time.
Bitcoin experienced a brief panic
区块客53m ago
Here’s the Litecoin (LTC) Price If Investors Start Treating LTC as Crypto’s Digital Silver
The Litecoin price edged up a bit today. LTC is trading around $56.39, about 1.4% higher than yesterday. The move came as Bitcoin lifted the rest of the market.
The earlier decline slowed down around $55.33, and this is where buying emerged and halted the fall. Since then, it has been stuck ar
CaptainAltcoin55m ago
Bull and bear battle imminent! Bitcoin approaches the "watershed" between bull and bear markets—can it break through and become a key factor for the future market?
Bitcoin prices have recently surged, approaching the critical threshold of $73,750 to $74,400, which is seen as a key point determining market fate. The market's reaction at this level will decide whether Bitcoin enters a new bull market or continues to decline. Historically, this price range has been a turning point for support and resistance, so traders remain highly vigilant about future movements.
区块客57m ago

