Oil prices rise amid US-Iran conflict, sparking concerns of inflation returning to 5%. However, analysts suggest that when priced in gold, Bitcoin’s bottom may appear as early as this month; technical support has already been seen, and a rebound toward $74,000 could be possible.
As the US conducts airstrikes on Iran, analysts say Bitcoin may be nearing its bottom?
During the joint US-Iran airstrikes on Iran, and following the death of Iran’s Supreme Leader Ali Khamenei, Rony Szuster, Research Director at Brazil’s largest cryptocurrency exchange Mercado Bitcoin, pointed out that when valued in gold, Bitcoin ($BTC) may be approaching its market bottom, potentially as soon as next month.
Historically, Bitcoin’s bear markets tend to last 12 to 13 months. When priced in USD, the downturn could extend until the end of 2026.
But when valued in gold, the timeline shifts. Szuster notes that the Bitcoin-to-gold price peaked in January 2025. If the previous 12 to 13-month cycle is used, Bitcoin might bottom around February this year and start rebounding in March.
Global uncertainties, escalating geopolitical tensions, and capital shifting into gold have all contributed to Bitcoin’s relative weakness compared to gold. Meanwhile, gold prices temporarily surged over 2%, reaching a high of $5,394 per ounce.
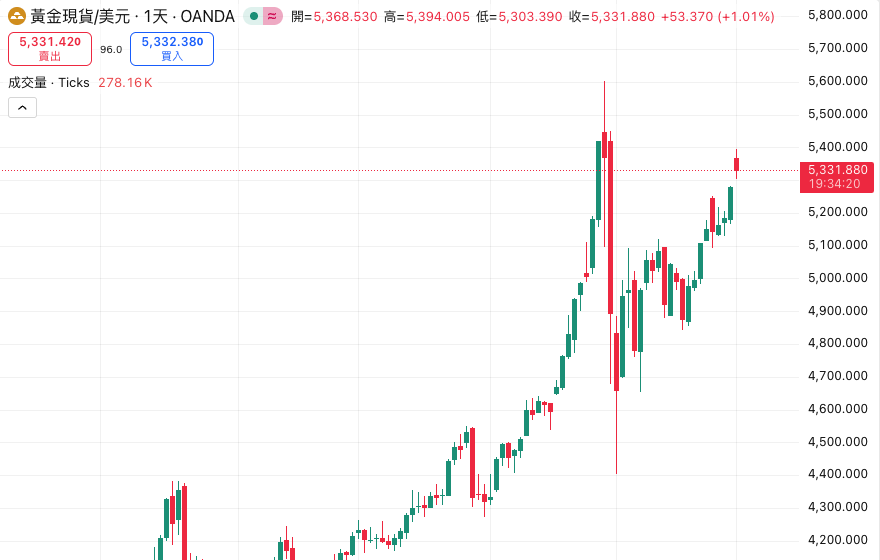
Image source: TradingView
Iran conflict impacts Strait of Hormuz, raising oil and inflation concerns
Due to the Iran conflict, oil prices surged significantly, with Brent crude rising about 8% to 10%, approaching $80 per barrel; US West Texas Intermediate (WTI) crude increased approximately 7% to 8%.
Iran announced it would block the Strait of Hormuz. Although the strait is international waters, it has become a bottleneck for oil transportation, prompting rapid analysis of potential chain reactions on US inflation.
Pratik Kala, Research Director at crypto investment firm Apollo Crypto, told Decrypt that if oil prices remain high, the risk of rising inflation data increases, which is unfavorable for risk assets and Bitcoin.
However, Kala also pointed out that OPEC countries hold large oil reserves that can fill supply gaps; additionally, US President Donald Trump would do his best to keep oil prices low, knowing this greatly influences American public sentiment.
US inflation data may return to 5%
Financial analysis media The Kobeissi Letter, citing JPMorgan research, states that the US Consumer Price Index (CPI) could surge to 5%. The last time US inflation hit 5% was in March 2023, when the Federal Reserve was actively raising interest rates.
Furthermore, data from the US Bureau of Labor Statistics (BLS) shows that in January, the Producer Price Index (PPI) increased by 0.5% month-over-month, significantly higher than the market expectation of 0.3%.
Bitcoin technical signals show support
As Middle Eastern turmoil begins to calm over the weekend, Bitcoin, which once dropped near $63,000, is now consolidating around $67,000.
According to Cointelegraph, noted crypto trader and analyst Michaël van de Poppe pointed out that the 21-day simple moving average (SMA) for Bitcoin is at $67,627. The Chicago Mercantile Exchange (CME) Bitcoin futures gap left over the weekend is at $65,880. Historically, markets tend to fill CME gaps.
CME gaps have long been an important indicator for traders, with the common expectation that Bitcoin will eventually fill these gaps, returning to pre-gap levels. For example, a bullish gap (opening price above previous close) may have its lower edge seen as potential support; conversely, a bearish gap (opening below previous close) may have its upper edge as resistance. Although filling gaps is often expected, not all CME gaps are filled, and traders’ expectations may sometimes be disappointed based on historical data.
Another trader, BitBull, analyzing the three-day trend, said that Bitcoin looks good in the short term.
He noted that after breaking support zones, Bitcoin has shifted resistance into support, and there’s a chance for a rebound between $73,000 and $74,000.
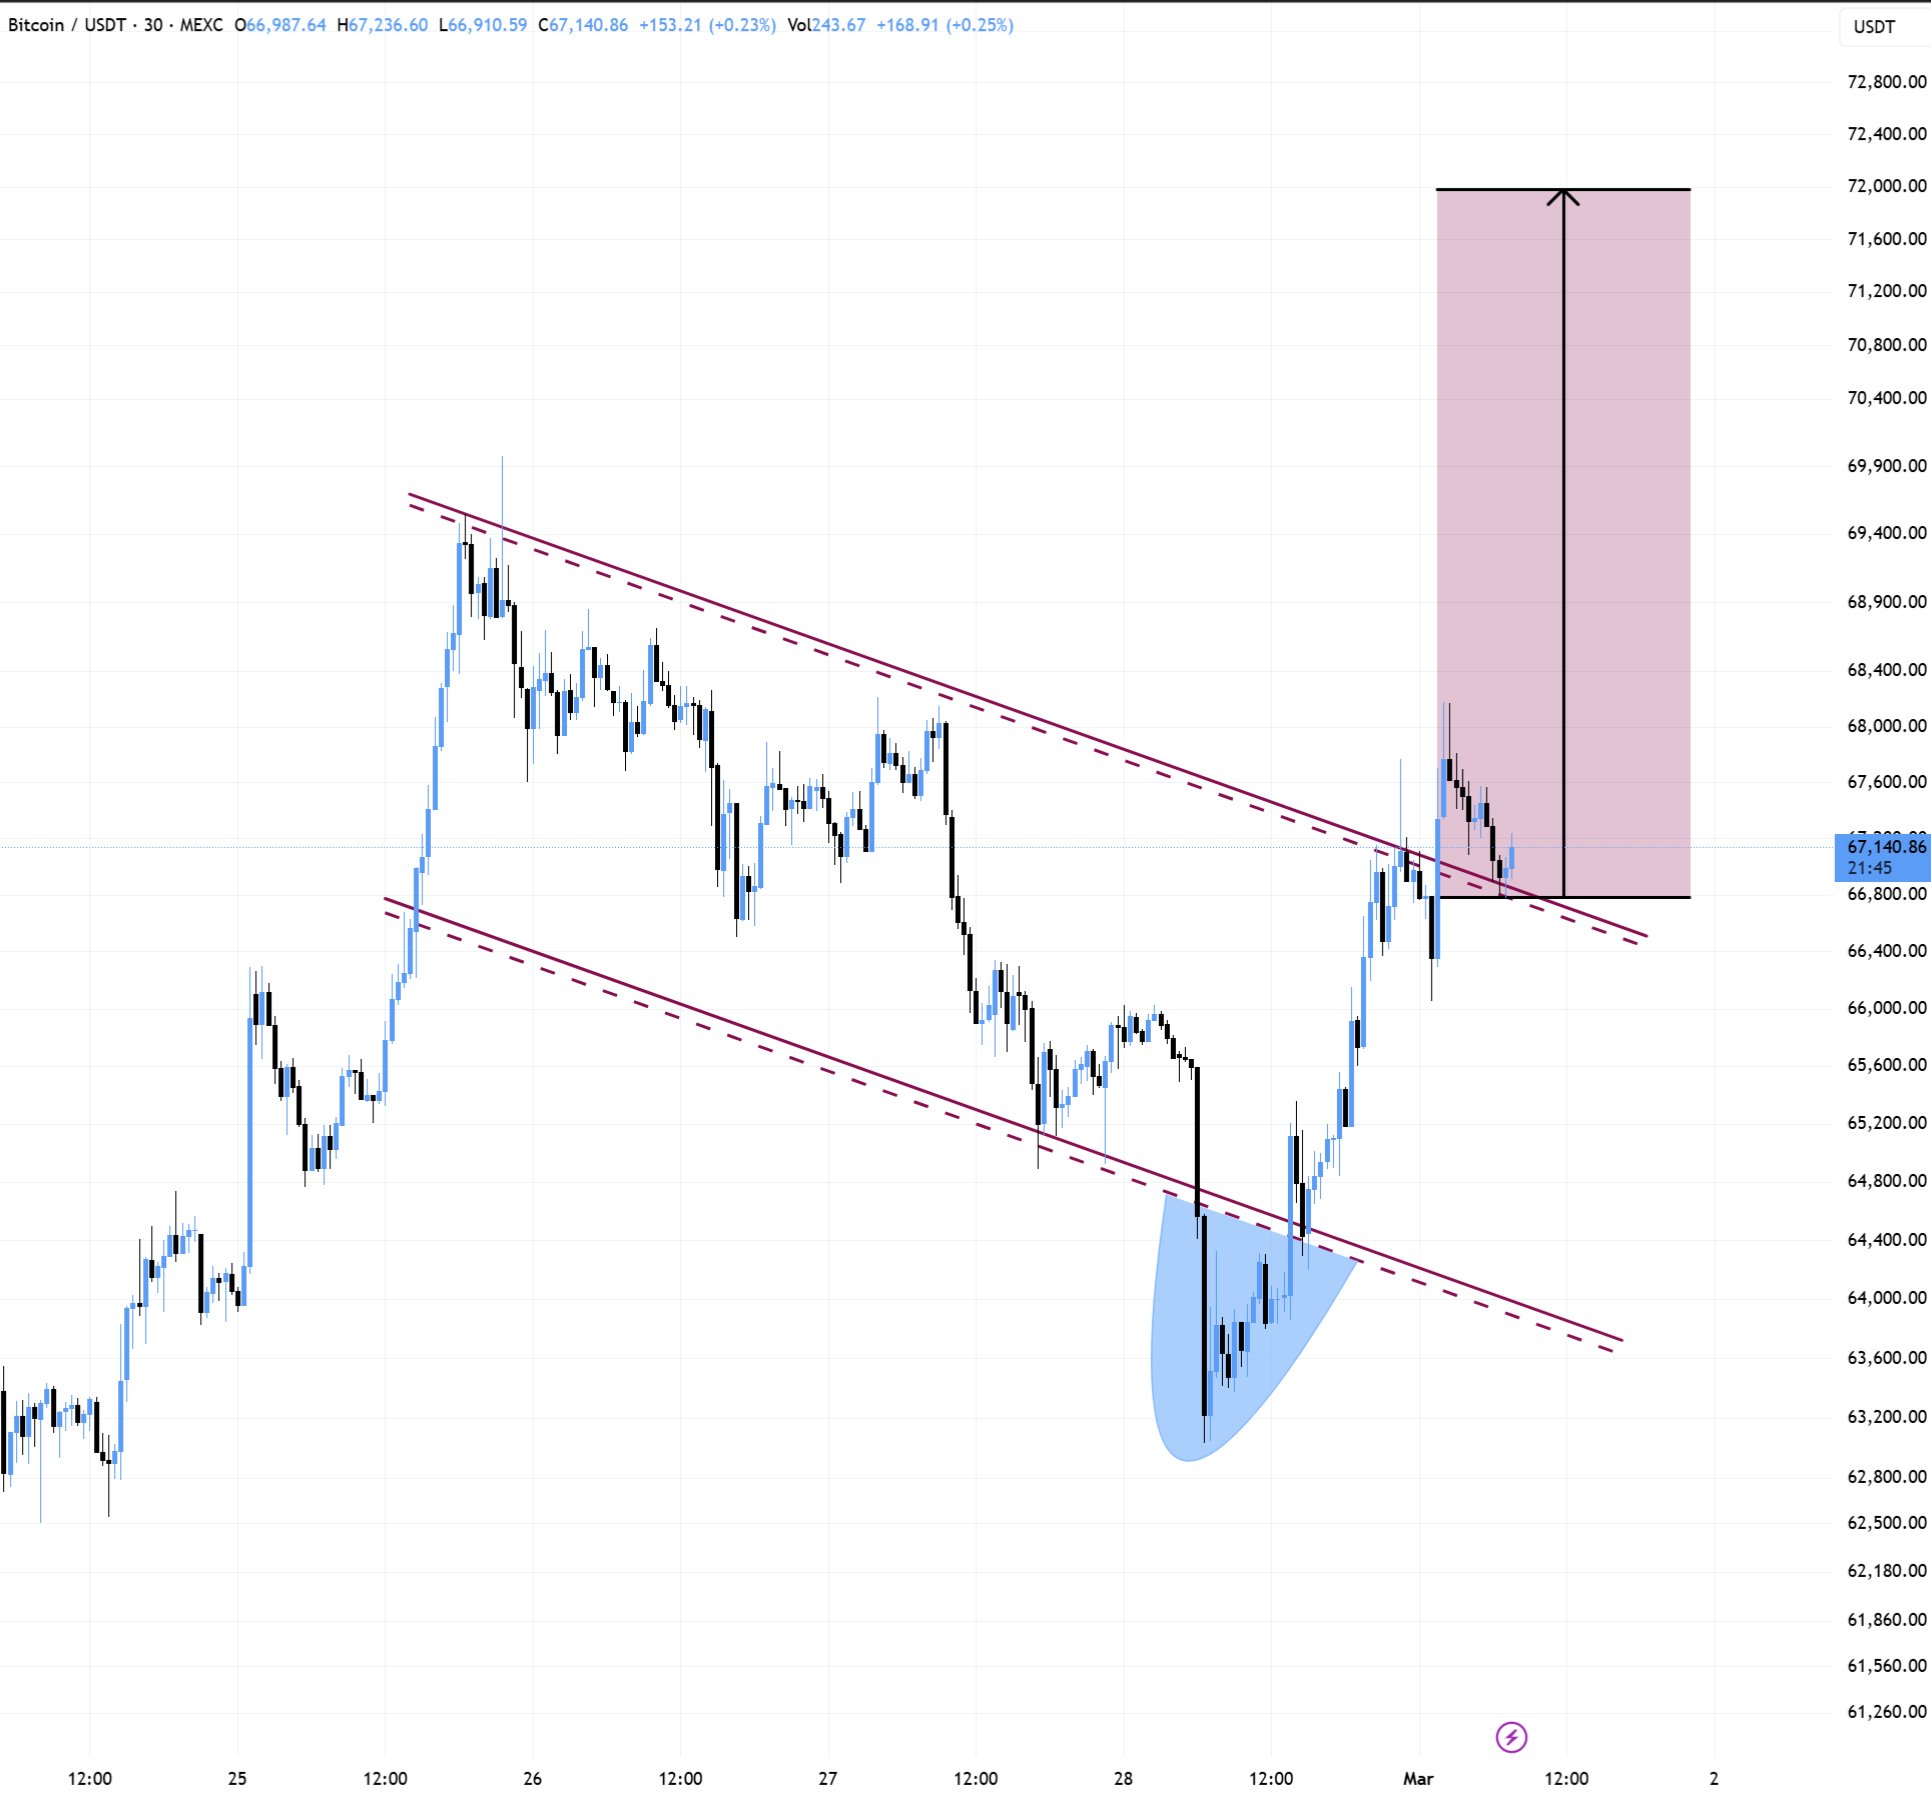
Image source: BitBull
This content is compiled by Crypto Agent from various sources, reviewed and edited by Crypto City. It is still in training, so there may be logical biases or inaccuracies. The content is for informational purposes only and should not be considered investment advice.
Disclaimer: The information on this page may come from third parties and does not represent the views or opinions of Gate. The content displayed on this page is for reference only and does not constitute any financial, investment, or legal advice. Gate does not guarantee the accuracy or completeness of the information and shall not be liable for any losses arising from the use of this information. Virtual asset investments carry high risks and are subject to significant price volatility. You may lose all of your invested principal. Please fully understand the relevant risks and make prudent decisions based on your own financial situation and risk tolerance. For details, please refer to
Disclaimer.
Related Articles
BTC 15-minute increase of 0.70%: On-chain capital inflow and market sentiment resonate to drive price movement
From March 10, 2026, 08:00 to 08:15 (UTC), BTC achieved a +0.70% return within 15 minutes, with a price range of 70375.2 to 70926.3 USDT and an amplitude of 0.78%. This short-term fluctuation is significantly higher than the volatility of mainstream coins during the same period, attracting market attention. The increased volatility has prompted investors to closely monitor the market.
The main driver of this fluctuation is large on-chain capital inflows into mainstream trading platforms, with a surge in short-term buying activity. Additionally, some institutional or whale accounts concentrated their positions during the window period, significantly driving the price upward. Meanwhile, market exchanges BTC
GateNews2m ago
JELLYJELLY Contract and Spot Price Discrepancy at 34%, Manipulation Warning Alert Triggered
JELLYJELLY tokens experienced an extreme divergence of 34% between the perpetual contract mark price and the on-chain spot price on March 10, suspected of price manipulation. Analysis shows a surge in open interest and a funding rate reaching -2% every 4 hours, indicating market instability and manipulation risk. Analysts warn investors that this situation could trigger significant price volatility and reflects structural risks during the integration process of decentralized and centralized exchanges.
MarketWhisper16m ago
SHIB Price Drops Despite 53,000% Burn Increase — Understanding the Disconnect
Burn Impact: 172 million SHIB burned reduces supply by 0.00003 percent, too small to move price.
Market Pressure: Bitcoin retreat drags SHIB lower despite burn spike and headlines.
Technical Signals: Price tests $0.00000545 support; break below $0.00000530 could trigger further
CryptoNewsLand38m ago
CPI Data Preview: Bitcoin Approaching $70,000 Key Resistance, Crypto Market May Experience Volatile Fluctuations
As the US CPI data is about to be released, the cryptocurrency market is entering a wait-and-see mode. Bitcoin, after experiencing a correction, is approaching $70,000, and market sentiment has improved, but it faces a short-term key resistance level. CPI data will be the main factor driving short-term market volatility.
GateNews38m ago
Is Bitcoin About to Break Through? Peter Brandt's "Banana Split" Pattern Indicates a Potential Significant Rise in BTC
Senior trader Peter Brant pointed out that Bitcoin is forming a "banana split" chart pattern, indicating potential significant volatility and a breakout from historical price ranges. The recent appearance of the "little banana" may be building momentum for a bull market. He predicts that Bitcoin will experience a price surge by October 2026. Global market sentiment is warming, fueling a 3.2% intraday increase in Bitcoin, currently trading at $69,803. Investors should pay attention to key price ranges to assess market trends.
GateNews51m ago
CRCL stock price increased by 87% in a month, driven by short squeeze and the dual factors of US-Iran conflict
CRCL stock price rose about 10% on March 9, with a total increase of 87.18% over the past month. Mizuho Bank analysts pointed out that this surge was driven by Middle East geopolitical conflicts leading to high oil prices, which boosted inflation expectations and increased the earnings of stablecoin issuers. Another analysis suggests that the stock price increase was mainly due to short covering. Valuation analysis indicates that CRCL's current stock price is above its intrinsic value, posing a risk of overvaluation.
MarketWhisper51m ago