
Altcoins have been stuck in the shadow of Bitcoin for years. Since the 2021 cycle peak, altcoin dominance has been in a steady downtrend.
Every rally attempt failed. Every breakout faded. Capital kept flowing back into BTC. For many investors, it has felt like a long grind with no real relief.
But now, one chart is starting to look very different.
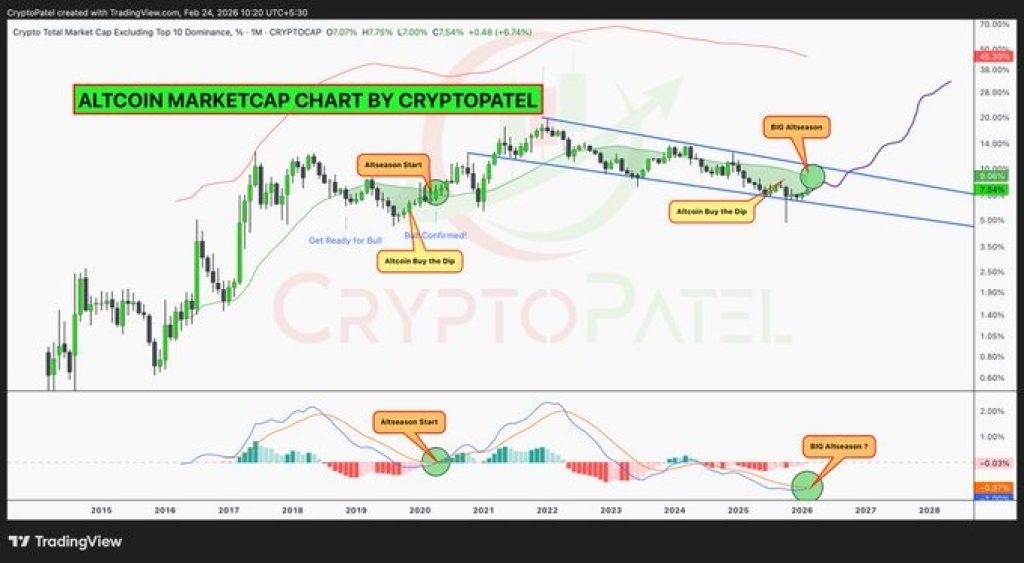
Crypto Patel shared a long-term altcoin dominance chart that shows a five-year descending trendline nearing a break.
More importantly, the MACD on the higher timeframe is about to print a bullish cross, the same type of signal that appeared before the 2020–2021 altcoin explosion.
Looking at the chart, altcoin dominance has respected a falling resistance line since the previous cycle high. Every time dominance pushed into that trendline, sellers stepped in.
Now price is pressing against it again. The structure shows repeated higher lows forming near support while resistance has remained flat.
That compression matters. When a market spends years building pressure under a descending line, the eventual break can be aggressive.
The chart even highlights previous “altseason start” zones in 2017 and 2020. Both were preceded by similar compression phases.
Source: X/CryptoPatel
However, below the chart, the MACD indicator is turning higher.
In both 2017 and 2020, a bullish MACD cross on the higher timeframe aligned with altcoin dominance breaking upward. What followed were massive expansions across the alt market, with many coins posting 10x to 20x moves.
Right now, the MACD is curling up again.
Volatility has been contracting for months. Dominance is sitting near a key inflection point. Liquidity appears to be building above current levels. This type of setup does not guarantee an explosion, but historically, this is how they begin.
_****Pi Network Posts Record Growth Metrics, So Why Does the Pi Coin Chart Look Dead?**
However, Altcoin dominance represents how much of the total crypto market cap is allocated outside of Bitcoin. When dominance rises, it means capital is rotating into altcoins.
For years, Bitcoin has controlled the narrative. But if dominance breaks this five-year trendline, it would signal a shift in market structure.
That shift is what traders call “altseason.”
It does not happen overnight. It starts quietly, often when sentiment is still skeptical.
Early or Late?
The chart does not promise 20x moves. Markets do not repeat perfectly.
But the technical structure looks similar to previous cycle turning points. A multi-year downtrend is being tested. Momentum is turning. Compression is extreme.
If dominance breaks and holds above resistance, the rotation into altcoins could accelerate quickly. After five years of underperformance, altcoins are back at a decision point.
Whether this becomes the next explosive phase or another fakeout depends on one thing: can dominance finally close above that long-standing resistance?
If it does, the market structure changes.
Disclaimer: The information on this page may come from third parties and does not represent the views or opinions of Gate. The content displayed on this page is for reference only and does not constitute any financial, investment, or legal advice. Gate does not guarantee the accuracy or completeness of the information and shall not be liable for any losses arising from the use of this information. Virtual asset investments carry high risks and are subject to significant price volatility. You may lose all of your invested principal. Please fully understand the relevant risks and make prudent decisions based on your own financial situation and risk tolerance. For details, please refer to
Disclaimer.
Related Articles
Bitcoin Hits 6-Year Peak in Whale Activity As Price Stands Stable Near $70K
Bitcoin ($BTC) has hit a 6-year high in whale activity, with the Exchange Whale Ratio rising to 0.62. This surge suggests a potential market turning point, as large holders position themselves for upcoming trends, presenting opportunities for retail investors amidst contrasting market sentiments.
BlockChainReporter4m ago
AI Track Crypto Assets Trading Heats Up, Bittensor (TAO) Weekly Gain Around 38.6%
On March 15th, 10x Research's quantitative model issued a strong altcoin buy signal, with Bittensor (TAO) standing out, maintaining prices above moving averages with gains of 38.6%. Meanwhile, NVIDIA launched an open-source AI platform, General Tensor secured $5 million in funding, and AI token trading volumes surged.
GateNews31m ago
Why OGN Just Moons 17.7% in 60 Minutes
OGN has surged 17.7% to $0.02294, with a 24-hour increase of 21.12% and trading volume reaching $662,137.16. Market trends and increased trader activity contribute to this volatility, with traders monitoring key resistance and support levels for future movements.
Coinfomania39m ago
Analyst Says XRP Is ‘Criminally Undervalued’ as RSI Drops
Analyst says XRP RSI reached oversold levels last seen during the 2022 bear market bottom.
XRP trades near $1.39 with key support at $1.30–$1.35 and resistance between $1.45 and $1.70.
Price has declined from about $3.10 since Sept 2025, forming a prolonged downward trend.
XRP trades near
CryptoFrontNews57m ago
'Rich Dad Poor Dad' Author: Bitcoin Will Go Up After 'Giant Crash' - U.Today
Robert Kiyosaki warns of an imminent economic crash, suggesting it’s a buying opportunity. He highlights Warren Buffett’s cash reserves and believes prices for gold, silver, and Bitcoin will rise post-crash, despite facing backlash over his investment claims.
UToday1h ago