
Last week, BitMine (BMNR) purchased 51,162 ETH, marking the largest weekly increase since December of last year, bringing its total ETH holdings to 4.42 million. According to a report from research firm Fundstrat, ETH’s current trading price is approximately 22% below the on-chain average cost basis of investors, with an implied 12-month return of 81% and a historical success rate of 87%.
BitMine’s ETH Reserve Strategy: Continuing Accumulation Despite Over $8.4 Billion in Losses
BitMine Chairman Thomas Lee stated in a Monday announcement that the company will continue to systematically execute its ETH reserve strategy during the current “small crypto winter,” aiming to steadily accumulate holdings and optimize long-term returns. As ETH has fallen over 50% in recent months and remains significantly below the average purchase cost of $3,821, data from the smart money tracking platform Lookonchain shows that BitMine currently has an unrealized paper loss of approximately $8.4 billion.
In addition to ETH holdings, BitMine’s balance sheet includes diversified assets:
Bitcoin (BTC): 193 coins
Beast Industries Shares: Market value approximately $200 million
Worldcoin (WLD) Treasury Shares: Market value approximately $17 million
Cash and other liquid assets: Total approximately $691 million
Lee’s announcement of increased holdings comes shortly after the release of a bullish Fundstrat report, with both signals emerging within the same timeframe, forming a primary basis for market expectations of ETH bottoming.
Fundstrat On-Chain Analysis: ETH Nearing Historical Bottom Reference Zone
Fundstrat analyst Sean Farrell, based on an on-chain actual cost basis model, pointed out that ETH’s current trading price is about 22% below the investor average cost, close to the historical reference values at the 2025 bear market low (21%) and the 2022 bottom (39%), indicating that the chip structure has entered a historical bottom zone.
According to this model, ETH’s implied bottom range is between $1,770 and $1,367, with an implied 12-month return of 81% and a success rate of 87%. Currently, ETH is trading around $1,896, above the implied bottom levels but still significantly below the average purchase cost.
Meanwhile, data from SoSoValue shows that Ethereum ETF (Exchange-Traded Fund) experienced net outflows of $123 million last week, indicating that institutional funds remain cautious in the short term, which somewhat conflicts with the on-chain bottom signals mentioned above.
Technical Outlook: Support at $1,404 and Resistance at $2,746 Dominating Short-Term Trends
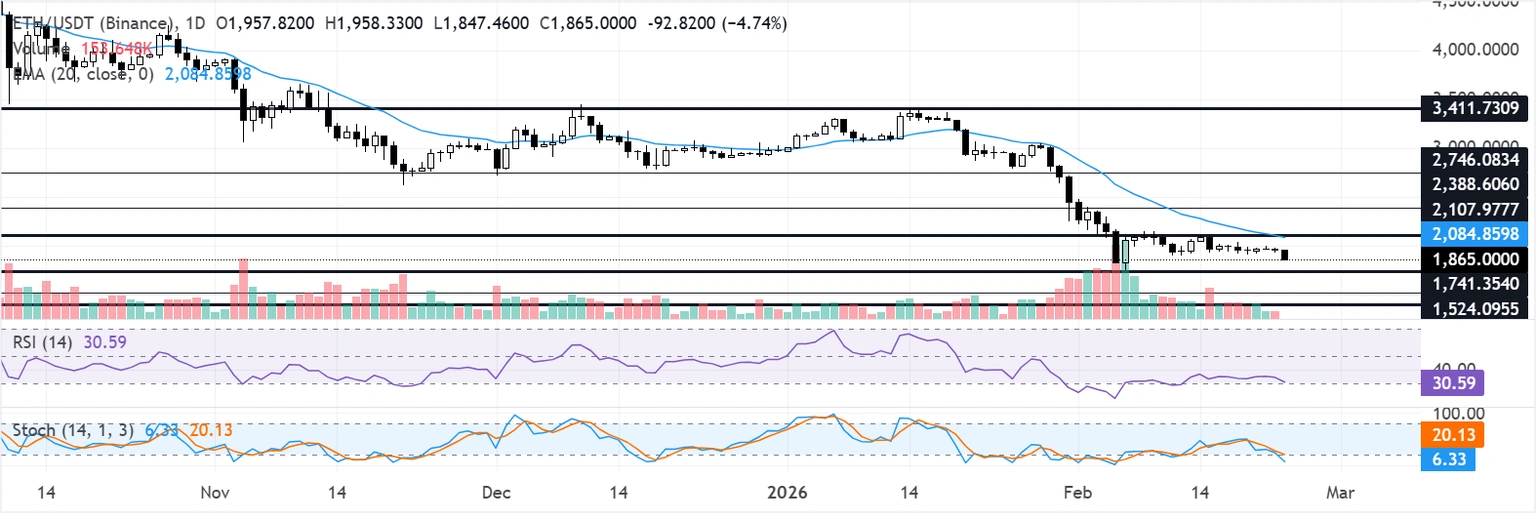
(Source: TradingView)
The daily chart shows ETH at $1,896, with the 20-day exponential moving average (EMA) at $2,087 and trending downward. The Relative Strength Index (RSI) is at 31, approaching oversold territory; the stochastic indicator (Stoch) is at 17, indicating short-term selling dominance, but the oversold condition could trigger a technical rebound.
According to Coinglass data, ETH experienced $135.8 million in liquidations over the past 24 hours, with longs accounting for $112 million, reflecting continued leverage pressure. Key technical levels are as follows: short-term resistance at $2,107 and $2,388, with further resistance at $2,746; support levels are at $1,741 and $1,524, with a critical support at $1,404 if broken.
Frequently Asked Questions
Q: Why is BitMine continuing to accumulate ETH despite huge unrealized losses on its books?
A: BitMine employs a long-term corporate asset reserve strategy, viewing ETH as a core reserve asset. Chairman Thomas Lee stated that the company evaluates its strategy from a long-term holding perspective. Short-term paper losses do not alter the overall direction, and the goal of increased accumulation is to optimize long-term returns.
Q: How should the 87% success rate from Fundstrat be interpreted?
A: Fundstrat compares ETH’s current market price to the on-chain investor average cost basis. Historically, in scenarios where the deviation is similar (around 22% below cost), holding ETH for 12 months has resulted in positive returns approximately 87% of the time. This is a statistical historical success rate and not a direct prediction of future performance.
Q: Does the continued outflow from ETH ETFs contradict the bottoming signals from on-chain data?
A: ETF fund flows reflect short-term institutional sentiment, while on-chain cost basis models measure long-term chip structure. They are different analytical frameworks and should be evaluated separately. Fundstrat’s bottom model primarily relies on on-chain data and does not incorporate ETF flows as a main variable.
Disclaimer: The information on this page may come from third parties and does not represent the views or opinions of Gate. The content displayed on this page is for reference only and does not constitute any financial, investment, or legal advice. Gate does not guarantee the accuracy or completeness of the information and shall not be liable for any losses arising from the use of this information. Virtual asset investments carry high risks and are subject to significant price volatility. You may lose all of your invested principal. Please fully understand the relevant risks and make prudent decisions based on your own financial situation and risk tolerance. For details, please refer to
Disclaimer.
Related Articles
A certain whale received 245 BTC again eight hours ago, accumulating a total of 495.3 BTC purchased over the past two weeks.
Gate News reports that on March 10th, according to The Data Nerd monitoring, eight hours ago, a whale address bc1q8 received another 245 BTC (approximately $16.8 million). Data shows that over the past two weeks, this whale has accumulated a total of 495.3 BTC (approximately $33.4 million) through an institution, with an average purchase price of about $67,430.
GateNews7m ago
Bitcoin returns to $70,000: Geopolitical conflict concerns ease, ETF fund inflows continue to drive BTC rebound
On March 10th, Bitcoin broke through $70,000 during the East Asian trading session, completing a recovery after the weekend sell-off. As volatility in the energy markets eased, selling pressure on risk assets diminished. Market data shows that institutional capital inflows continue to support Bitcoin, investor sentiment is improving, and short-term upside potential is increasing.
GateNews14m ago
Yesterday, the US Bitcoin spot ETF experienced a net inflow of $57.73 million.
Gate News Report, March 10 — According to crypto analyst Trader T's monitoring, on March 9, the US Bitcoin spot ETF saw a net inflow of $57.73 million. Among them, FBTC (Fidelity) had a net inflow of $60.09 million; BITB (Bitwise) had a net outflow of $4.49 million; ARKB (Ark) had a net outflow of $274 million.
GateNews31m ago
Peter Brandt releases Bitcoin chart analysis showing a short-term bullish pattern
Gate News Announcement, March 10, renowned trader and chart analyst Peter Brandt released a Bitcoin chart analysis. Peter Brandt successfully predicted the 2018 Bitcoin crash. The chart shows the "Big Banana" chart displaying a large upward curved channel on the long-term weekly chart (2014-2027); the "Small Banana" chart shows a smaller similar curve currently forming near $69,000 on the daily chart. The arrows in the chart clearly point upward, indicating higher targets.
GateNews52m ago
BTC Price Fluctuation Analysis
# BTC Price Movement Deep Attribution Report for March 10, 2026, 02:30-02:45 (UTC)
## 1. Event Overview
Between 02:30 and 02:45 (UTC) on March 10, 2026, Bitcoin (BTC) experienced a significant price movement, with a return of +1.39%. The price fluctuations during this time window exceeded normal ranges, attracting market attention. This report will conduct a comprehensive attribution analysis based on on-chain data, market conditions, macroeconomic environment, trading behaviors, and other dimensions to uncover the true causes of the event and provide insights for investors.
GateNews59m ago