Kaspa (KAS) has been busy on the development side, even though price has been under pressure with the rest of the market.
The network crossed 600 million total transactions, showing strong usage and throughput. A new smart contract language called Silverscript was also announced, opening the door for native DeFi directly on Kaspa’s Layer 1.
On the institutional front, Zodia added custody support and a regulated ETP launched in Sweden. Despite those headlines, KAS is trading around $0.03081, and the chart still looks cautious.
- Here’s What The KAS Chart Is Showing
- What the Indicators Are Showing
- Kaspa Price Targets to Watch This Week
Here’s What The KAS Chart Is Showing
On the 4H chart, the Kaspa price has been drifting lower for weeks.The pattern indicates lower highs, with the price being squeezed in a tight range around $0.030.
There was a recent pullback that temporarily took the price lower, but the buyers acted quickly. Since then, KAS has been moving sideways, holding just above the $0.030 level.
That area is now acting as short-term support. Right now, this looks more like consolidation than a breakout setup.
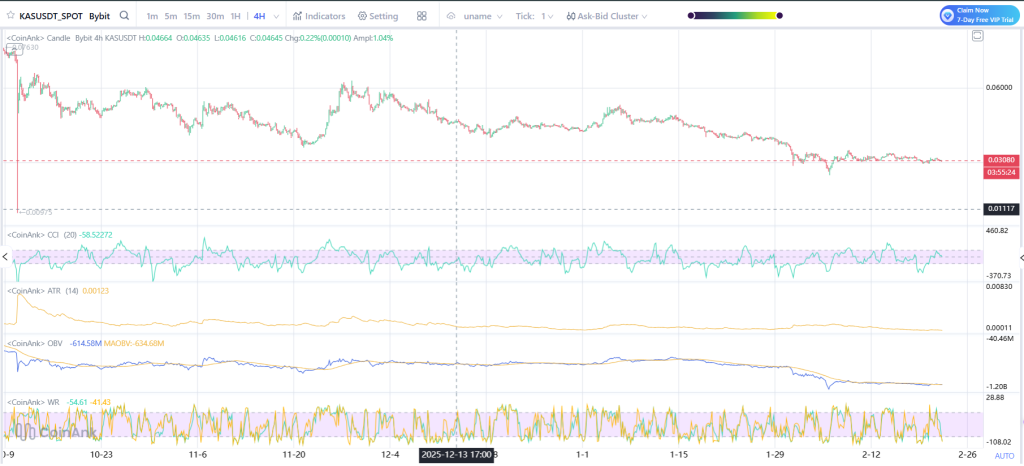
Source: Coinank
What the Indicators Are Showing
The CCI is hovering slightly above zero, which shows momentum is neutral. It is not deeply oversold, and it is not showing strong upward strength either.
ATR has dropped compared to earlier moves, which means volatility is cooling off. When volatility contracts like this, it usually means the market is waiting for a larger move.
OBV has been slowly trending down, which shows that buying pressure has not returned in a strong way yet. Volume has not picked up in a convincing manner.
However, the KAS price is stable, but there is no strong bullish push on the chart right now.
_****XRP Price Just Flashed a Historic Capitulation Signal**
Kaspa Price Targets to Watch This Week
If KAS holds the $0.030 level and starts pushing up, $0.033 is the first area to watch. Above that, $0.036 is the next hurdle since price broke down from there before.
If the buying pressure increases and the market becomes stable, KAS may move towards $0.040. If $0.030 breaks, the next target could be $0.027. Below that, $0.025 is the next level of support.
For now, the KAS price is boxed in. A clear move above $0.033 or below $0.030 will likely set the tone for the rest of the week.
Disclaimer: The information on this page may come from third parties and does not represent the views or opinions of Gate. The content displayed on this page is for reference only and does not constitute any financial, investment, or legal advice. Gate does not guarantee the accuracy or completeness of the information and shall not be liable for any losses arising from the use of this information. Virtual asset investments carry high risks and are subject to significant price volatility. You may lose all of your invested principal. Please fully understand the relevant risks and make prudent decisions based on your own financial situation and risk tolerance. For details, please refer to
Disclaimer.
Related Articles
DWF Labs: Traditional Altseason Coming to an End, Institutional Capital Shifting to BTC, ETH, and RWA
Andrei Grachev from DWF Labs points out that the traditional "altseason" is gradually disappearing due to structural changes in the crypto market. Institutional capital increasingly favors Bitcoin and Ethereum, exposing altcoins to higher risks and capital outflows. Over the past 13 months, altcoin market capitalization has declined by over $209 billion.
GateNews5m ago
Bitcoin rose 8.55% this week, potentially marking the largest single-week gain since September 2025
Gate News reported on March 15 that according to Coinglass data, Bitcoin's weekly return rate is currently at 8.55%, with a historical average return rate of -1.03%. Despite the escalating Iran-Israel conflict and prevailing risk-averse sentiment in the market, Bitcoin is poised to record its largest single-week gain since September 2025. During the same period, the S&P 500 index (the benchmark index for the U.S. stock market) declined by 1.60%, with BTC's performance significantly outperforming the U.S. stock market.
GateNews13m ago
AI Predicts Where ADA Price Is Headed Next After Cardano’s Technical Flip
Something just changed on Cardano’s 4-hour chart. The ADA price climbed 1.61% in the last few hours, closing at $0.2649. More importantly, it broke above two key moving averages, and the AI tool used by a well-known community analyst just turned positive.
Vincent van Code, a software
CaptainAltcoin27m ago
Crypto Market Update – River and DeXe Lead Gains As Political Memecoins Stir Volatility
The crypto market has continued to undergo rapid changes and temporary spurts in specific sectors than many other markets during its most recent period of consolidation. The “Gainers” chart on CoinMarketCap is often reviewed for trends that correlate with major cryptocurrency assets like Bitcoin and
BlockChainReporter1h ago