Silver has been on a bit of a rollercoaster lately. After a strong push higher earlier this year, the silver price suddenly hit a rough patch. The market sold off hard, momentum cooled down fast, and it felt like bulls completely lost control for a moment.
But here’s the interesting part. The chart is starting to look a lot less bearish than it did just a couple of weeks ago. Instead of continuing to free-fall, the Silver price is beginning to steady itself, and traders are starting to notice the early signs of a potential reversal.
One interesting new development alongside all of this is that silver is no longer only a traditional futures trade. On Hyperliquid, silver can now be traded fully on-chain, meaning no-KYC access, instant execution, and the ability to trade even during weekends, unlike traditional TradFi metals platforms that shut down outside market hours. For traders who want flexibility this is a major change and with our link and code CAPTAIN4, trading fees also come with a discount.
Silver Is No Longer Making Fresh Lows
The cleanest thing on this chart shared by Rashad Hajiyev is the shift in structure. After that nasty dump from the $120 area, silver printed a deep low in the mid-$60s (around $66–$68), then snapped back and started carving out a new base.
The latest dip didn’t break that low, it held around $76–$77, and the price is now sitting near $77.39. That “higher low” is exactly what traders want to see when a down-move starts losing control.
The next fight is the descending trendline that’s been swatting down every bounce since the sell-off. On this chart, that ceiling is sitting in the $84–$86 zone.
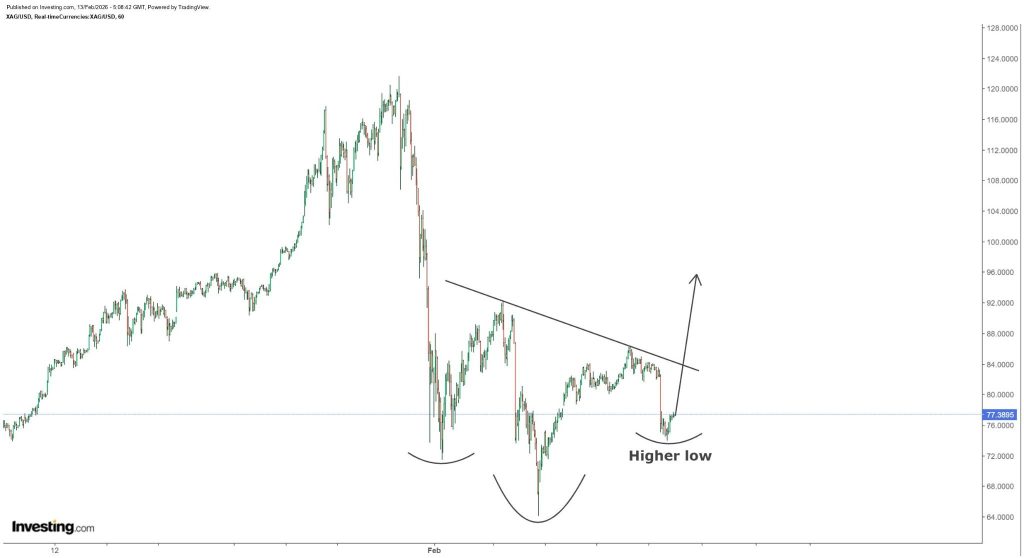
Source: X/@Hajiyev_Rashad
Silver has already tried to push into that area before and got rejected, so it’s not a random line, it’s the level that decides whether this is just another bounce or the start of a real reversal.
If silver can get a clean break and hold above $85-ish, the chart opens up fast. The first obvious upside area is the prior swing zone around $90, and after that, the next big magnet sits closer to $96. If the trendline holds again, it’s back to watching the $76–$77 support band, because losing that higher low would put the recovery attempt on pause.
Hyperliquid (HYPE) Just Hit $5.2B Metals Volume in 1 Day: Here’s How to Trade Silver and Gold On-Chain_**
A Breakout Could Lead to a Fast Upside Move
Right now, the setup is pretty clear. Silver has a higher low forming, price is compressing under resistance, and the structure looks like it’s tightening up for the next big move.
That doesn’t guarantee a breakout, but this is exactly the kind of pattern that often shows up near major turning points. If buyers step in and silver clears resistance, the next upside push could happen quickly.
For now, the Silver price is sitting at a really interesting crossroads, and this chart pattern is why traders are starting to pay attention again.
Disclaimer: The information on this page may come from third parties and does not represent the views or opinions of Gate. The content displayed on this page is for reference only and does not constitute any financial, investment, or legal advice. Gate does not guarantee the accuracy or completeness of the information and shall not be liable for any losses arising from the use of this information. Virtual asset investments carry high risks and are subject to significant price volatility. You may lose all of your invested principal. Please fully understand the relevant risks and make prudent decisions based on your own financial situation and risk tolerance. For details, please refer to
Disclaimer.
Related Articles
XRP Price Hints at Bullish Reversal as Negative Funding Rates Build Pressure on Short Sellers
XRP shows potential for a bullish reversal as market indicators align, with negative funding rates possibly triggering a short squeeze. Technical patterns and whale accumulation further support an upward move, indicating a significant price change may be imminent.
CryptometerIo28m ago
Shiba Inu (SHIB) regains momentum as buying pressure reaches the highest level of the month
The price of Shiba Inu (SHIB) is fluctuating around the 0.0000056 USD mark at the time of writing on Wednesday, after rising nearly 7% over the past two days. This recovery trend appears as on-chain indicators and derivatives market data begin to send positive signals. Trading volume is increasing.
TapChiBitcoin1h ago
Goldman Sachs: Hedge fund positioning may create conditions for a rebound in US stocks, with short positions rising to the highest since September 2022
Goldman Sachs report indicates that the structure of hedge fund positions in the US stock market is creating conditions for a market rebound. Speculators maintain long positions while shorting ETFs and futures. Short positions have reached their highest level since September 2022, reflecting market responses to uncertainty. If positive news emerges, it could trigger a rapid market rally.
GateNews1h ago
ETH 15-minute increase of 0.83%: Whales' capital inflow and DeFi lending demand resonate to drive the price
Between 13:30 and 13:45 (UTC) on March 11, 2026, ETH experienced a short-term fluctuation. The candlestick data shows a return of +0.83%, with a price range of 2046.07 to 2082.31 USDT, and an amplitude of 1.77%. Market activity increased during this period, with trading volume significantly higher than the previous cycle, and volatility exceeding the intraday average, attracting widespread market attention.
The main drivers of this fluctuation were the rapid inflow of large on-chain funds and active institutional accounts. Between 13:32 and 13:43,
GateNews1h ago
BTC 15-minute increase of 0.73%: Large capital inflows and technical breakout drive short-term rally
From 2026-03-11 13:00 to 2026-03-11 13:15 (UTC), the BTC price achieved a +0.73% return within 15 minutes, with a range quote of 69,338.6 to 69,975.0 USDT, and an amplitude of 0.92%. During this period, market activity significantly increased, trading volume surged compared to the previous period, market attention heated up, and short-term bullish sentiment dominated the market.
The main driver of this anomaly was large on-chain capital flows — in the first 10 minutes before the event, multiple large BTC transfers flowed into a major exchange's hot wallet, indicating
GateNews2h ago