Solana faces a correction phase: Selling pressure increases and the support level $75 is being tested
Solana (SOL) has entered a correction phase after failing to sustain its recent strong recovery. It peaked near $88 on February 8 before entering a steady downtrend. Since then, the SOL price has decreased by nearly 10%, with selling pressure significantly increasing over the past 24 hours.
Although the current downtrend shows no signs of a complete reversal, technical data and on-chain metrics indicate that this correction largely stems from weak market participation. With short-term traders increasing activity, Solana now depends on buying support around the $75 level to avoid deeper losses. The question is whether speculative capital, which often withdraws quickly, can sufficiently defend this critical support level.
Hidden Bearish Divergence and Exchange Inflows Trigger the Correction
The first warning signal appeared on the 12-hour chart just a few trading sessions ago.
Between February 6 and 8, Solana formed a lower high near $88, while the Relative Strength Index (RSI) made a higher high. RSI measures momentum by tracking buying and selling pressure in the market. When prices form lower highs while RSI forms higher highs, it indicates a hidden bearish divergence—an underlying weakening of momentum despite stable prices.
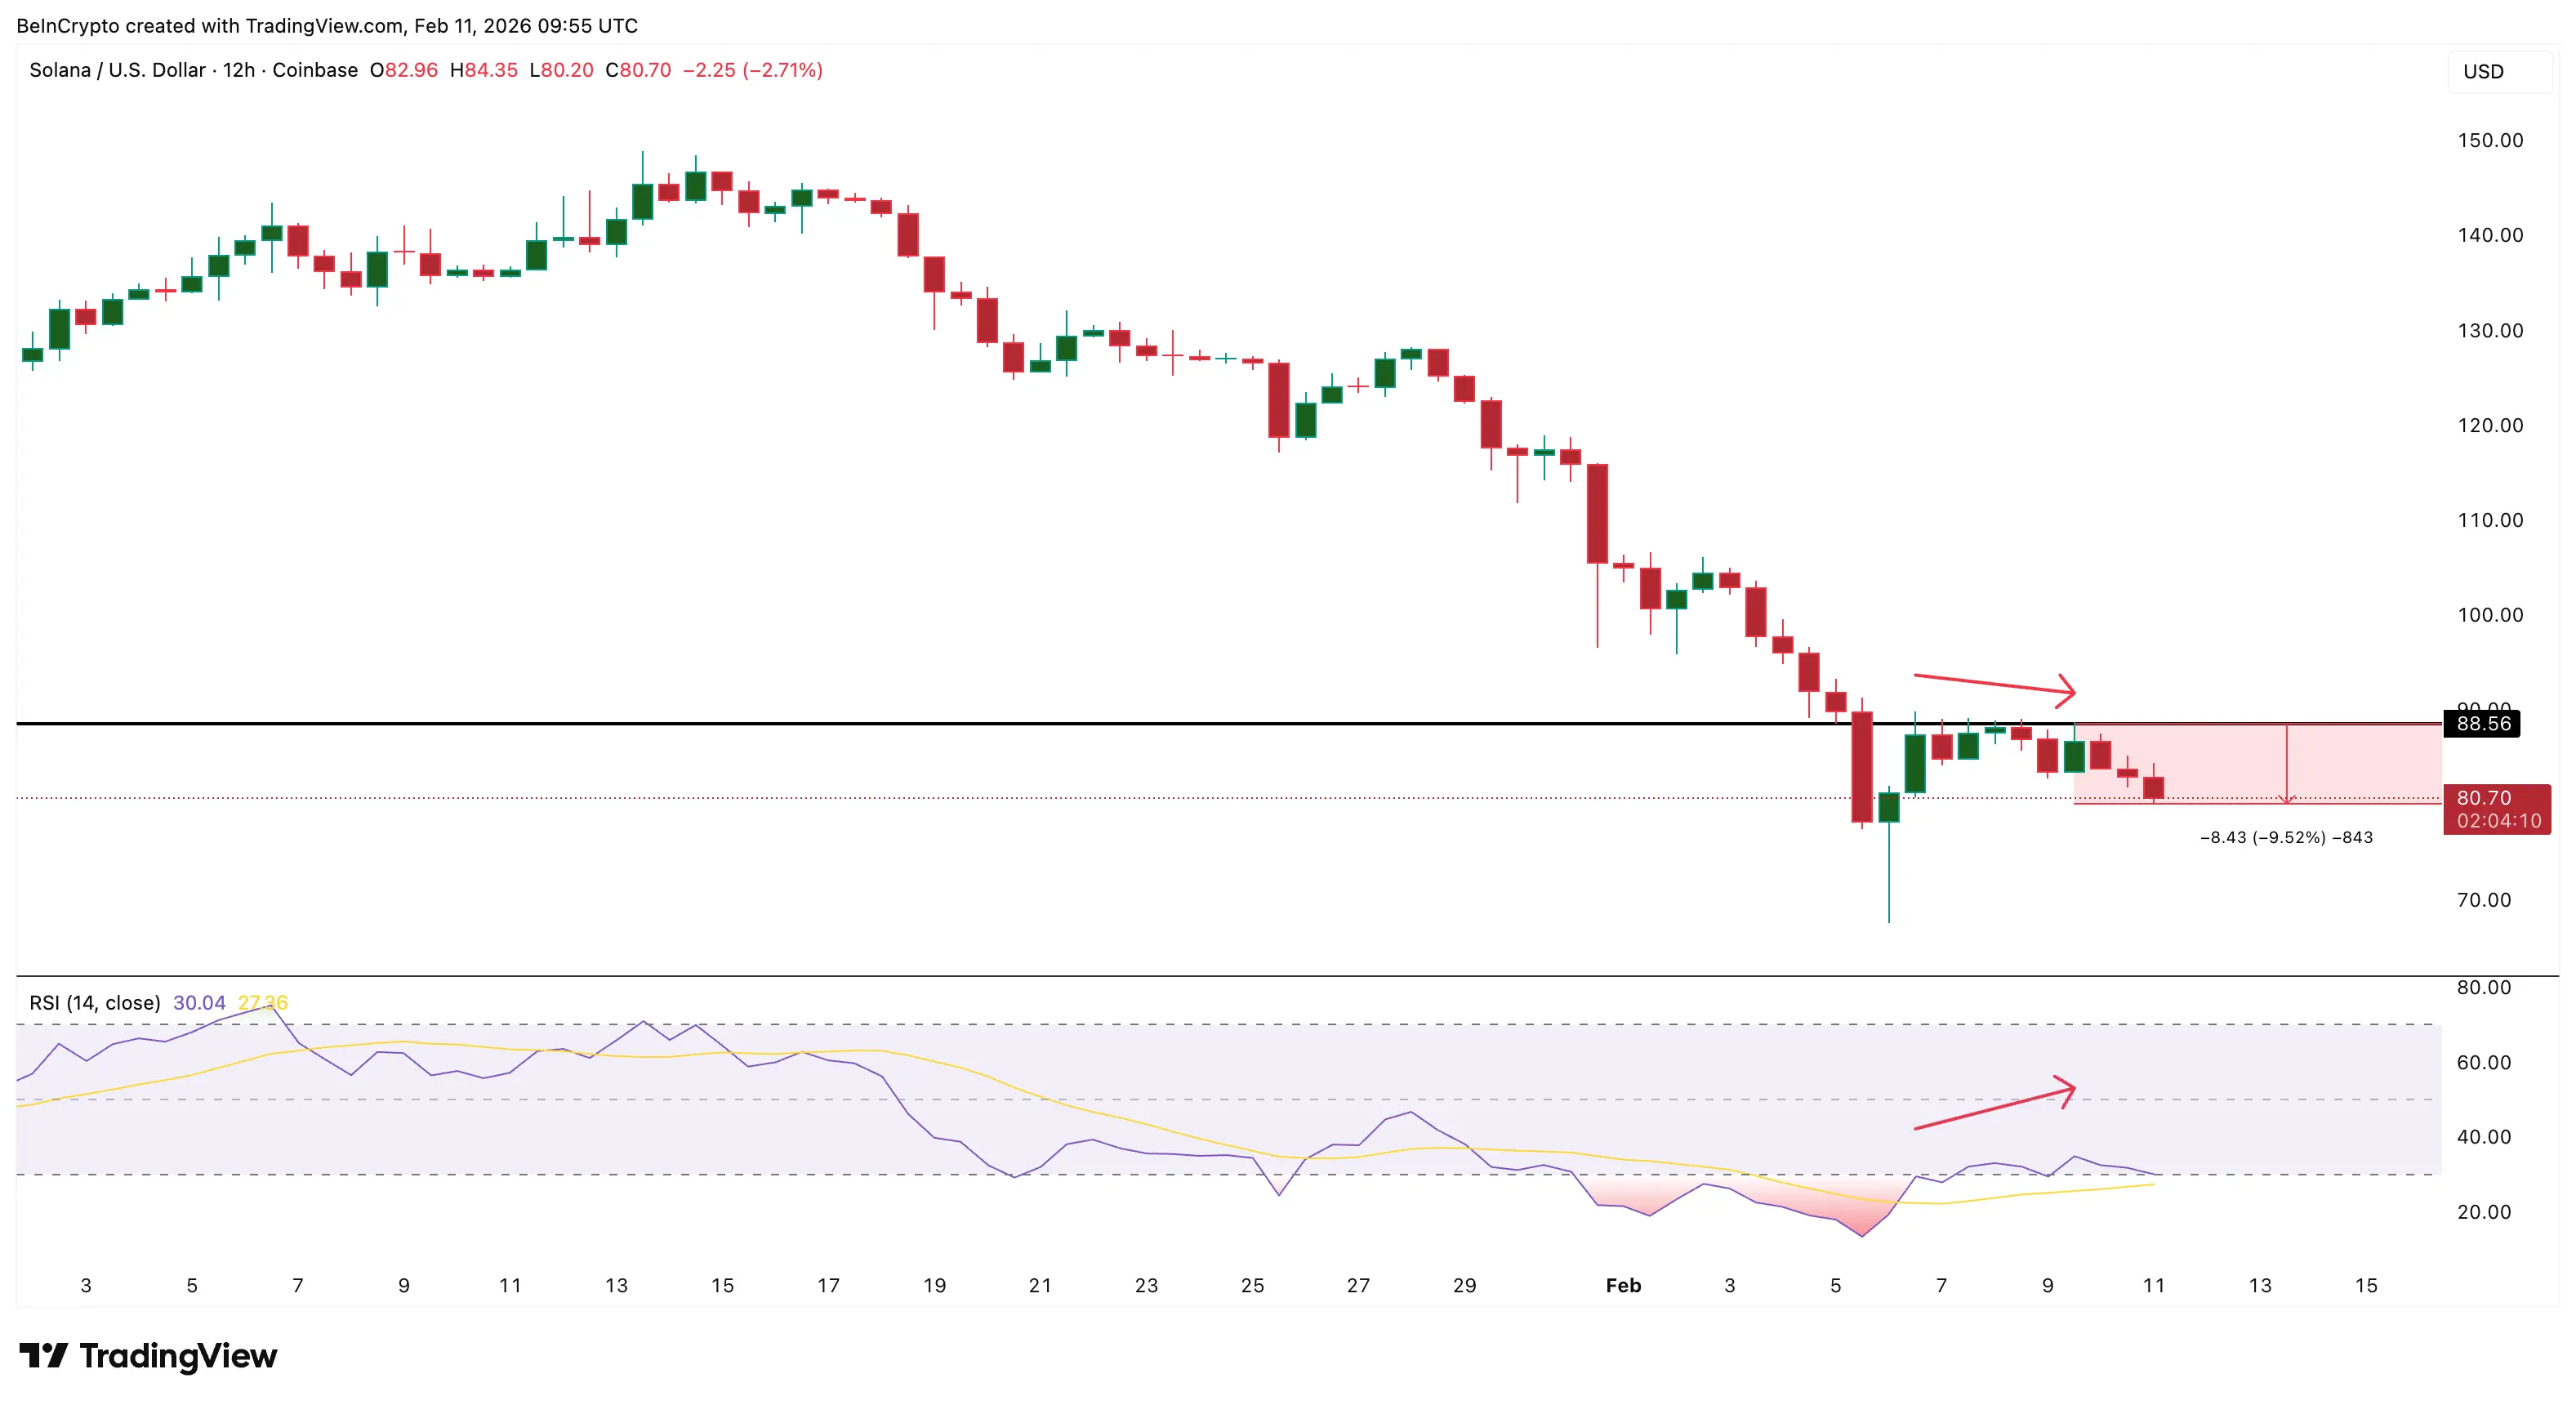 Hidden Bearish Divergence in Solana | : TradingViewImmediately after this divergence appeared, the SOL price began to retreat.
Selling pressure intensified as exchange inflows showed a strong shift. The Exchange Net Position Change indicator—tracking tokens transferred onto or off exchanges over 30 days—recorded a notable change. When this indicator turns positive, it suggests an increasing number of tokens being sent to exchanges for sale.
Specifically, on February 9, this indicator registered a net outflow of approximately −538,878 SOL, indicating rising buying pressure. However, by February 10, it reversed, recording a net inflow of about +245,691 SOL, reflecting increased selling activity.
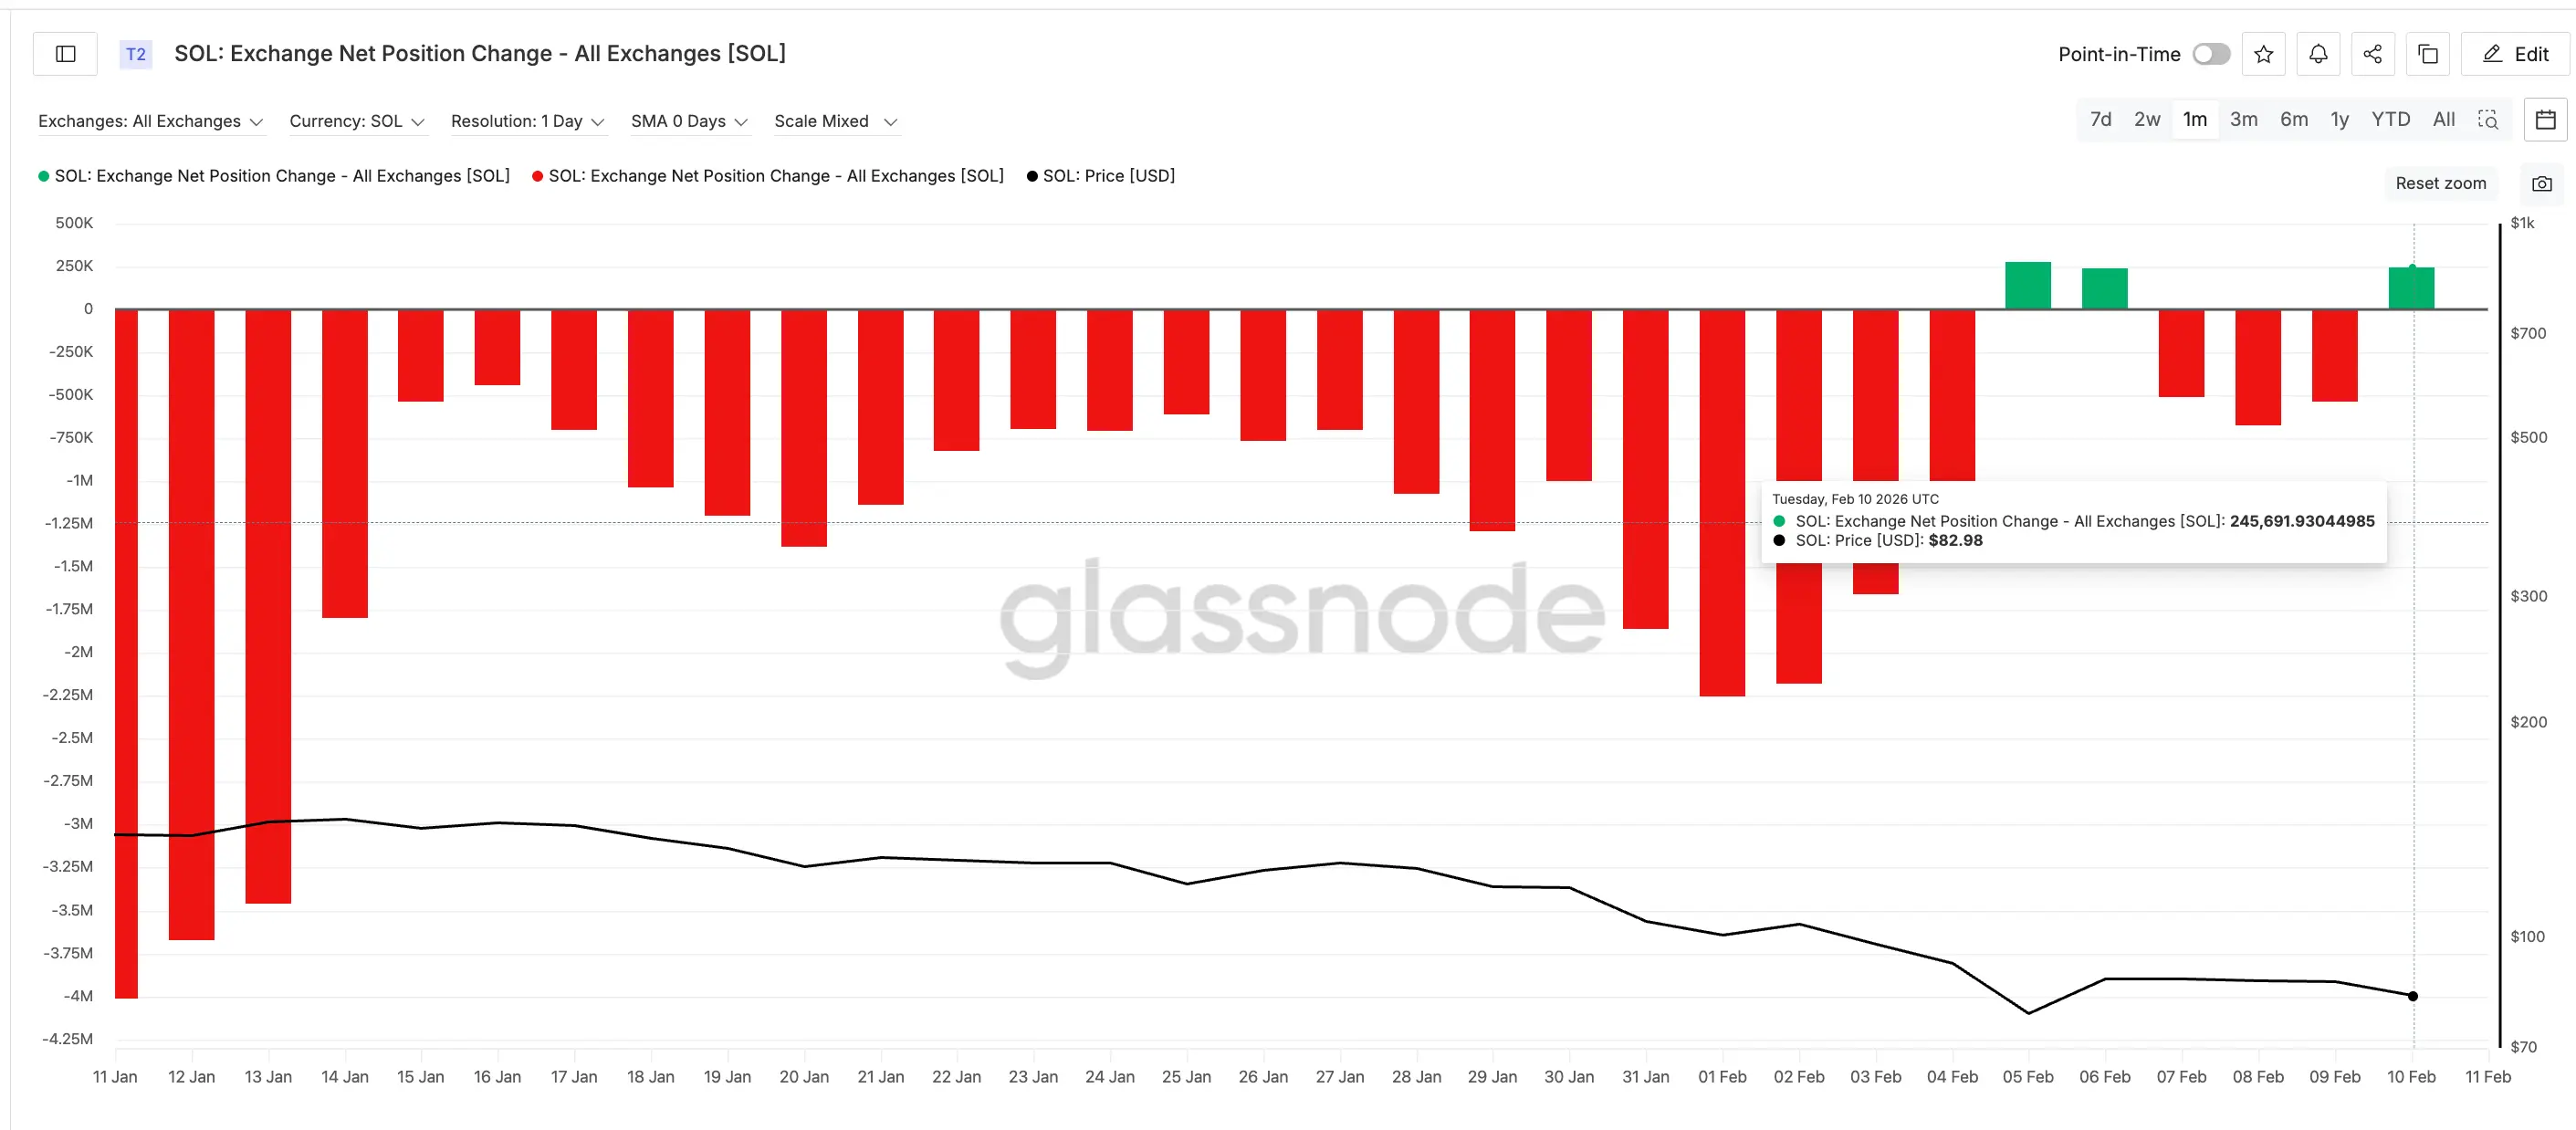 Solana Exchange Inflows | Source: GlassnodeThis change led to Solana dropping over 4% in the past day and continuing to weaken since February 8. The combination of technical weakening and increased token inflows onto exchanges has accelerated the correction.
Short-term Buyers Absorb Supply but Lack Stability
Although exchange inflows increased, not all investors are selling. However, the group participating during this period raises concerns.
Data from the HODL Waves indicator shows that the proportion of tokens held by short-term investors (from one day to one week) is rising sharply. This group is highly speculative, often engaging during correction phases and quickly withdrawing once they reach expected profits. HODL Waves analyze wallets based on holding duration, providing deeper insights into investor behavior.
Since February 8, the short-term holding proportion has increased from about 5.39% to 6.81%—a significant rise, indicating a surge in speculative activity.
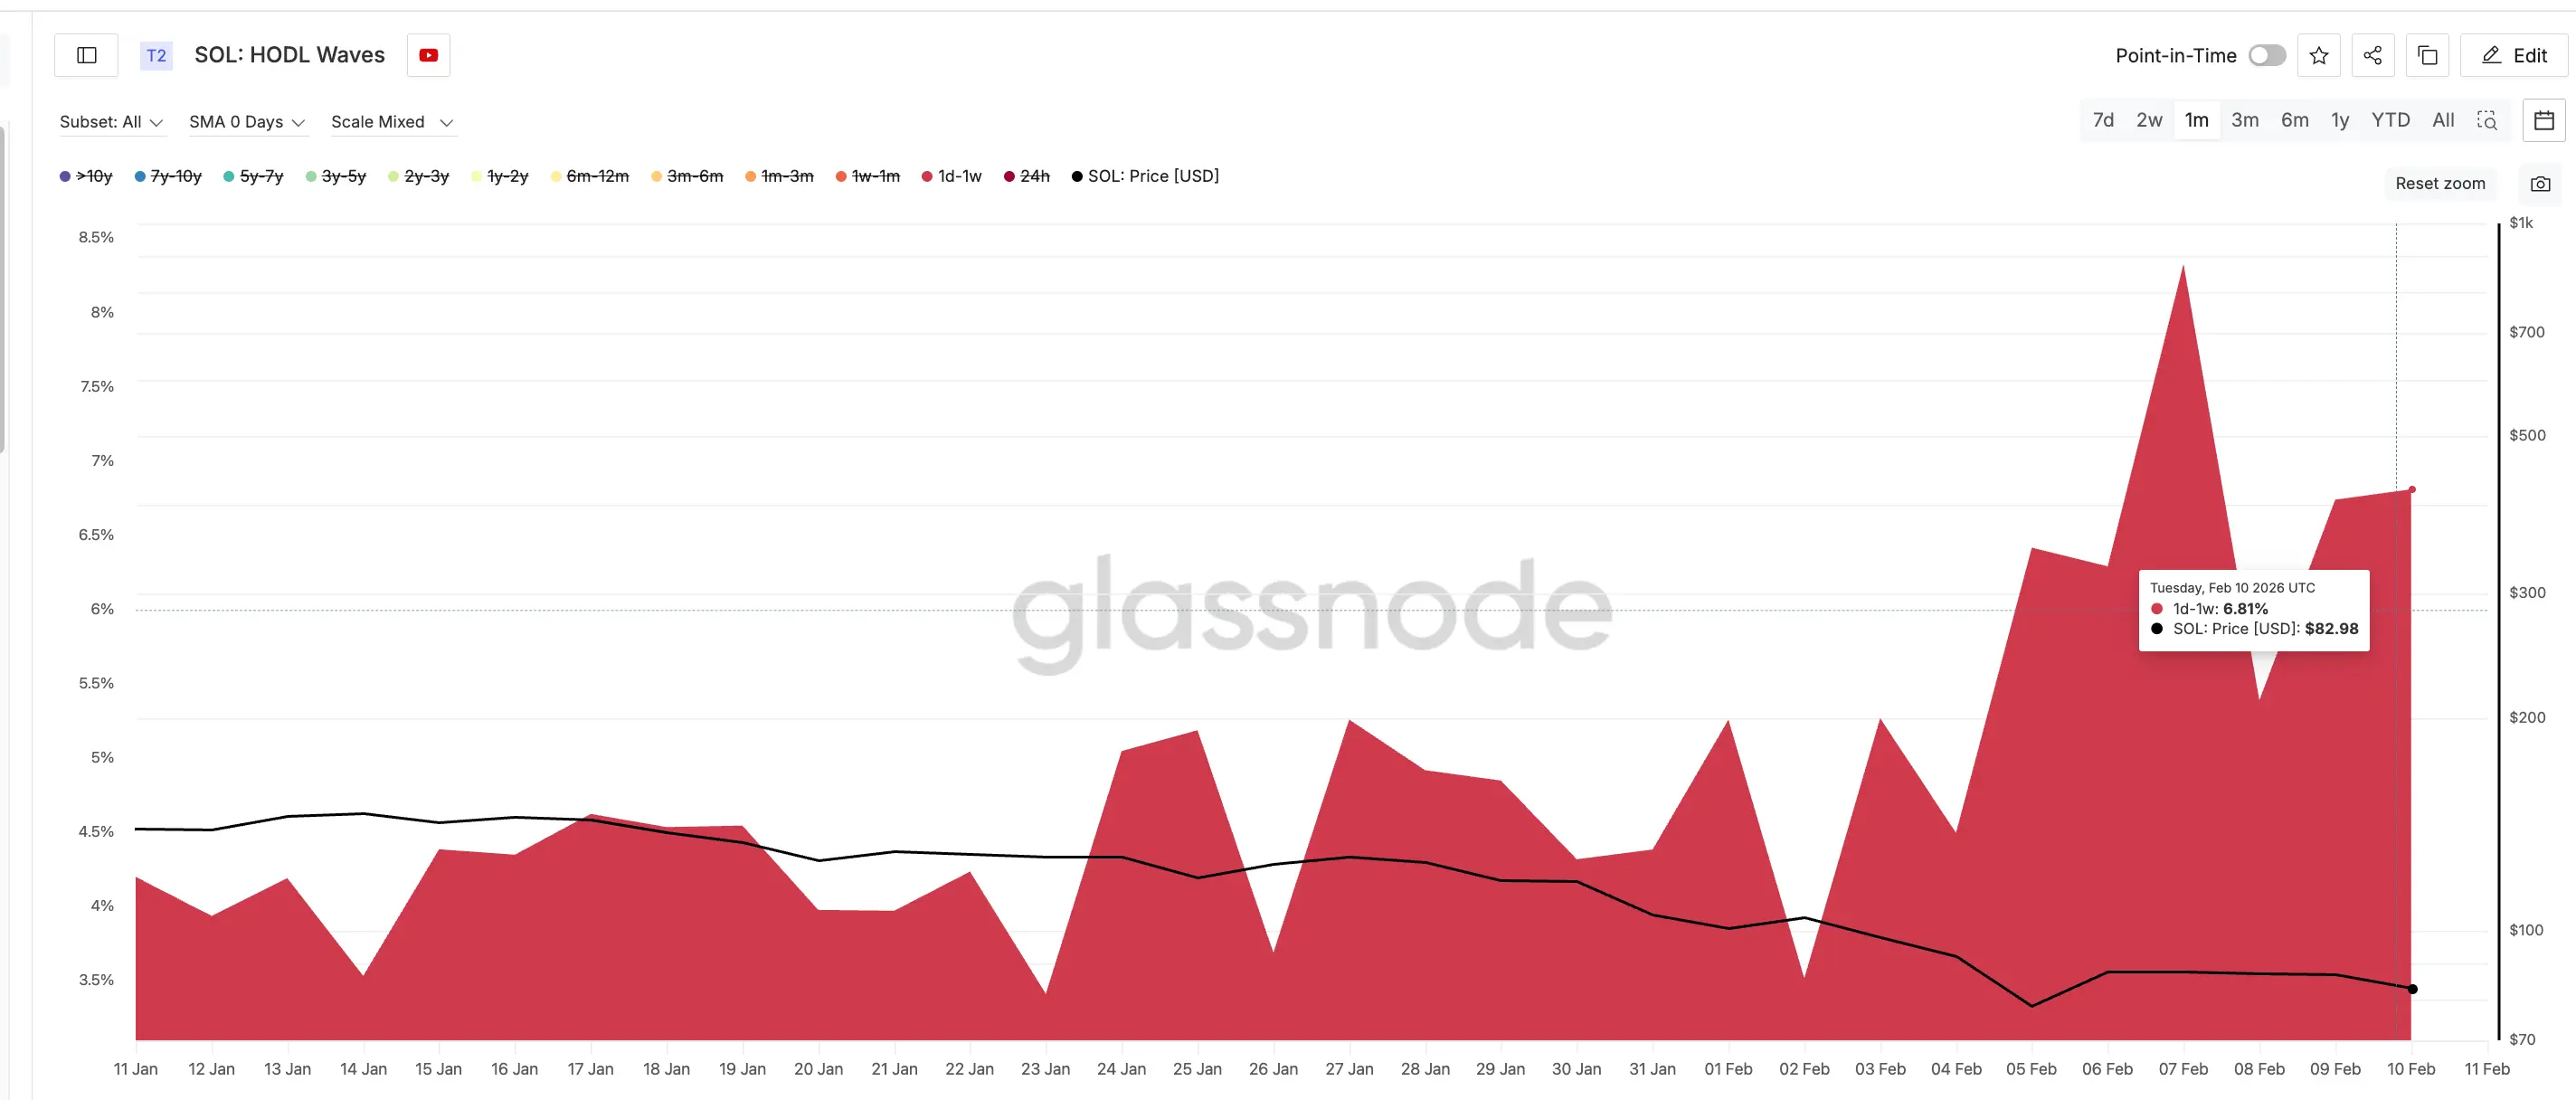 Potential Risky Buyers | Source: GlassnodeHowever, history shows that this group often cannot provide sustainable support for the price. For example, on January 27, when SOL traded near $127, short-term investors controlled about 5.26% of the supply. But just a few days later, on January 30, this proportion dropped to 4.31% due to panic selling, causing the price to fall roughly 8%. Currently, a similar behavioral pattern appears to be repeating.
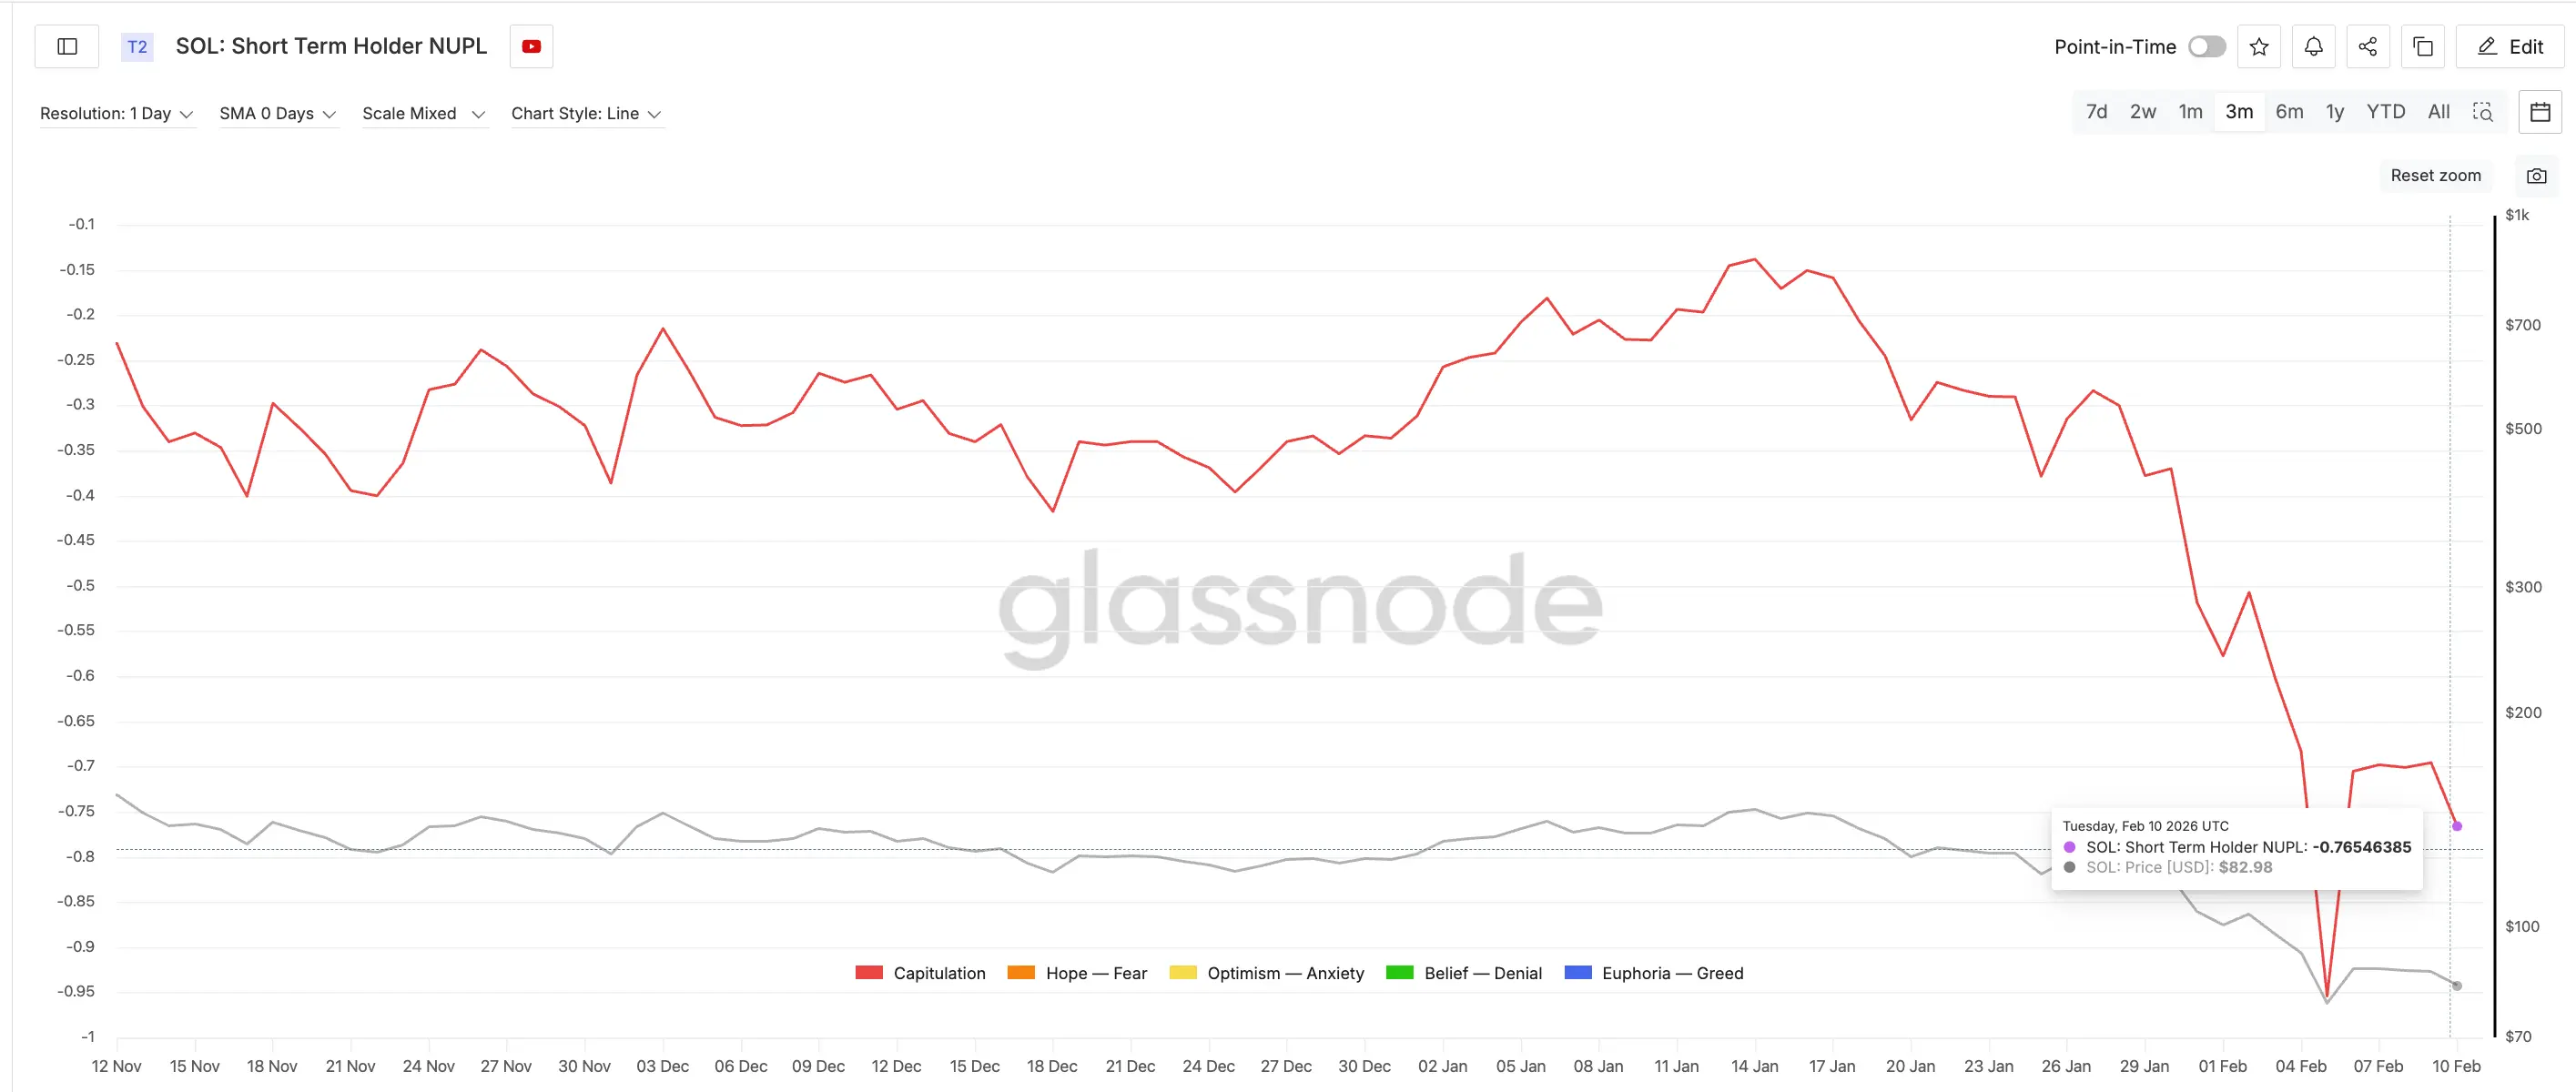 Short-term NUPL | Source: GlassnodeIn summary, Solana faces a significant correction driven by waning momentum and increased selling pressure from exchange inflows. Protecting the $75 support level will be crucial in determining whether Solana can sustain a long-term uptrend or if it will continue to decline.
Related Articles
Jito Loses $2.77B in TVL – What’s Happening on Solana?
Solana Price Stabilizes Above $85 Amid Weak Trend Momentum
The Next Few Days Will Decide Whether Solana Price Pumps to $150 or Drops to $50
Did an AI robot also "slip up"? A tipping mistake ended up sending $440,000 worth of tokens to a struggling online user.