Bitcoin plummeted on Thursday to $60,000, dropping 17% in 24 hours before rebounding to $64,100. In just four hours, $817 million was liquidated, and the Fear & Greed Index fell to a new low of 5. Analysts say support levels have been repeatedly broken, traders have shifted from bottom-fishing to cautious waiting, and institutional ETFs have experienced outflows of $800 million over two days. Maintaining above $58,000-$60,000 is crucial for a potential rebound.
Bitcoin Flash Crash: $817 Million Liquidated in 4 Hours
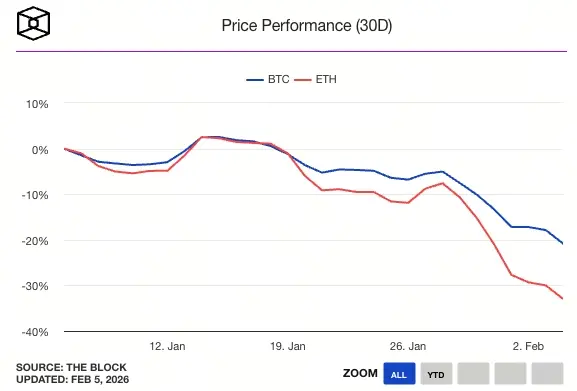
(Source: The Block)
The flash crash of Bitcoin peaked Thursday evening at 7:20 PM Eastern Time, when the world’s largest cryptocurrency fell to $60,000, a decline of about 17% over the past 24 hours. According to Bitcoin’s price page on The Block’s website, Bitcoin then experienced a partial rebound, climbing back to around $64,100, reflecting increased market volatility. Ethereum’s price briefly dropped to $1,750, and at the time of writing, it was trading around $1,899.
This single-day plunge from an opening of $73,100 to a low of $60,000 is one of the most severe in Bitcoin’s history. A 17% drop signifies a price movement that might take weeks in traditional markets, but only a day in crypto. Even more startling is the speed at which it broke below the psychological $60,000 level, crashing almost without any significant support, leading to a rapid and steep decline.
According to data from Coinglass, in the past four hours, Bitcoin’s flash crash resulted in a total liquidation of $817 million across both long and short positions. This concentrated liquidation indicates a “liquidation cascade,” where rapid price declines trigger mass leveraged position liquidations, causing automatic forced sales on exchanges, which adds to selling pressure and drives prices even lower.
In the past 24 hours, total liquidations reached $2.67 billion, with longs accounting for $2.31 billion. Long liquidations made up over 86%, showing that most leveraged traders remained bullish before the crash, only to be ruthlessly liquidated during the sharp decline. In contrast, short liquidations were about $360 million, indicating that short-sellers profited from the downturn.
Bitcoin Flash Crash Liquidation Data
Liquidations in 4 hours: $817 million
Total in 24 hours: $2.67 billion
Longs liquidated: $2.31 billion (86%)
Shorts liquidated: approximately $360 million
Lowest point reached: $60,000
Rebound to: approximately $64,100
The Crypto Fear & Greed Index from CoinMarketCap is currently at 5, indicating “Extreme Fear”—the lowest reading since the index was launched in June 2023. The index ranges from 0 to 100, with lower values indicating greater market fear. A reading of 5 suggests the market is near despair, a sentiment often observed at market bottoms, but it could also signal that further declines are possible.
Traders Shift from Bottom-Fishing to Caution
Vincent Liu, Chief Investment Officer at Kronos Research, stated: “The Bitcoin flash crash appears to be the result of multiple factors working together: over-leveraged longs being forced to liquidate, ETF and institutional outflows, and rising macroeconomic risk aversion. It’s a classic leveraged liquidation event, driven by sharp, rapid, emotion-driven selling.”
Liu pointed out that Bitcoin’s surrender indicator just posted its second-largest increase in two years, indicating a significant rise in forced selling. The surrender indicator measures long-term holders’ selling pressure on-chain; when it spikes, even steadfast HODLers begin to panic and sell. Such capitulation often signals a market bottom, but during extreme panic, the bottom may still be ahead, requiring time to confirm.
Rachael Lucas, crypto analyst at BTC Markets, said: “Market sentiment is clearly risk-averse. Traders are no longer trying to bottom-fish but are prioritizing capital preservation. This is evident from the fading rebound and declining trading volume after liquidations subside.” This behavioral shift is critical, showing that the market has fully transitioned from “greed” to “fear.”
There is a well-known saying in crypto: “Don’t catch a falling knife.” This metaphor vividly describes the risk of trying to buy the dip during a sharp decline. When prices fall rapidly, every seemingly “cheap” level can quickly become “cheaper.” Traders learn from painful past experiences that attempting to bottom-fish before a trend reversal can turn into a new wave of losses.
BTC Markets analysts note that support levels have been repeatedly broken, causing traders’ behavior to shift from buying dips to waiting for confirmation, further reinforcing the downward momentum. This change in mindset creates a self-reinforcing downward cycle: as no one wants to buy, prices fall further; falling prices scare off potential buyers even more. Only when prices stabilize at certain levels for a sufficient period will traders regain confidence.
Institutional ETF Outflows of $800 Million in Two Days Worsen Panic
Compared to retail investors, institutional investors typically allocate funds for long-term holdings, but they have also begun liquidating spot Bitcoin ETFs—over $800 million outflows on Tuesday and Wednesday. Institutional withdrawals are more concerning than retail panic because their decisions are often based on in-depth research and risk models; their exit may reflect pessimism about fundamentals.
Lucas said: “I believe the long-term conviction remains, but short-term positions have clearly been adjusted. Historically, such phases tend to weed out weak-handed investors, while long-term holders remain relatively unscathed. The conviction isn’t gone; it’s just being tested.” This statement aims to reassure markets but also admits that short-term selling pressure still exists.
ETF outflows have multiple effects. First, they directly reduce buying support in the market. The ETF creation and redemption mechanism means that when investors redeem ETF shares, authorized participants (APs) must sell corresponding Bitcoin on the market, creating additional selling pressure. Second, institutional outflows impact market sentiment; seeing institutions exit often prompts others to follow.
From a capital flow perspective, institutional funds are not flowing into other crypto assets but are leaving the entire crypto market. This “exodus” rather than “rotation” indicates a decline in confidence across the crypto asset class, not just Bitcoin. Such systemic loss of confidence is a core reason behind the Bitcoin flash crash.
Over Tuesday and Wednesday, $800 million flowed out, averaging about $400 million per day. If this outflow continues at the same rate, nearly $3 billion could exit in a week. Such a scale of capital withdrawal can fundamentally impact supply and demand, making it difficult for even the largest Bitcoin market to absorb such massive selling in a short period.
$58,000-$60,000 as the Last Defense Line
Liu from Kronos said Bitcoin needs to hold the critical support zone of $58,000 to $60,000 to stabilize the market and enable a potential rebound. He added: “Price stabilization and positive news could trigger a rebound, but it will take time to confirm, and only after the dust settles can we verify it.”
Why is $58,000-$60,000 so crucial? From a technical perspective, this range is a key resistance zone before the 2024 bull market begins. Under the “resistance turns support” principle, it should provide strong defense. Psychologically, $60,000 is an important round number, with many investors’ mental stop-loss levels at this point. From a cost basis perspective, many investors’ average entry points cluster around this zone, giving them motivation to defend it.
If Bitcoin cannot hold this zone after the flash crash, the next support might be at $50,000-$55,000. This area was an important support in early 2024 but is about 15-20% below current levels. In a more extreme scenario, if $50,000 also fails, Bitcoin could test deeper support at $40,000, implying nearly 70% decline from the all-time high of $126,000.
However, historical experience shows that Bitcoin’s flash crashes often precede strong buying opportunities. The March 2020 “Black Thursday,” May 2021’s “519 Crash,” and November 2022’s FTX collapse all saw vigorous rebounds in subsequent months or weeks. The key is identifying genuine bottom signals, not rushing to buy too early.
Is the current Bitcoin flash crash already a bottom? Analysts generally believe more confirmation signals are needed. These include: price stabilizing at $58,000-$60,000 for several days, volume increasing at lows, the Fear & Greed Index starting to rise, and ETF outflows slowing or turning into inflows. Only when multiple indicators turn positive together can a bottom be confidently confirmed.