MicroStrategy (MSTR) broke below the 200-week and 50-month moving averages, with a weekly low of 104 signaling a bearish outlook. RSI reached oversold levels not seen since March 2020 but proved ineffective. Resistance is at $146, with the 10-week moving average at 159 approaching a death cross. Next support is at 102-101, with a potential drop to 80. The ABCD pattern’s extreme target is $61.
Technical Disaster: Breaking below the 200-week and 50-month moving averages
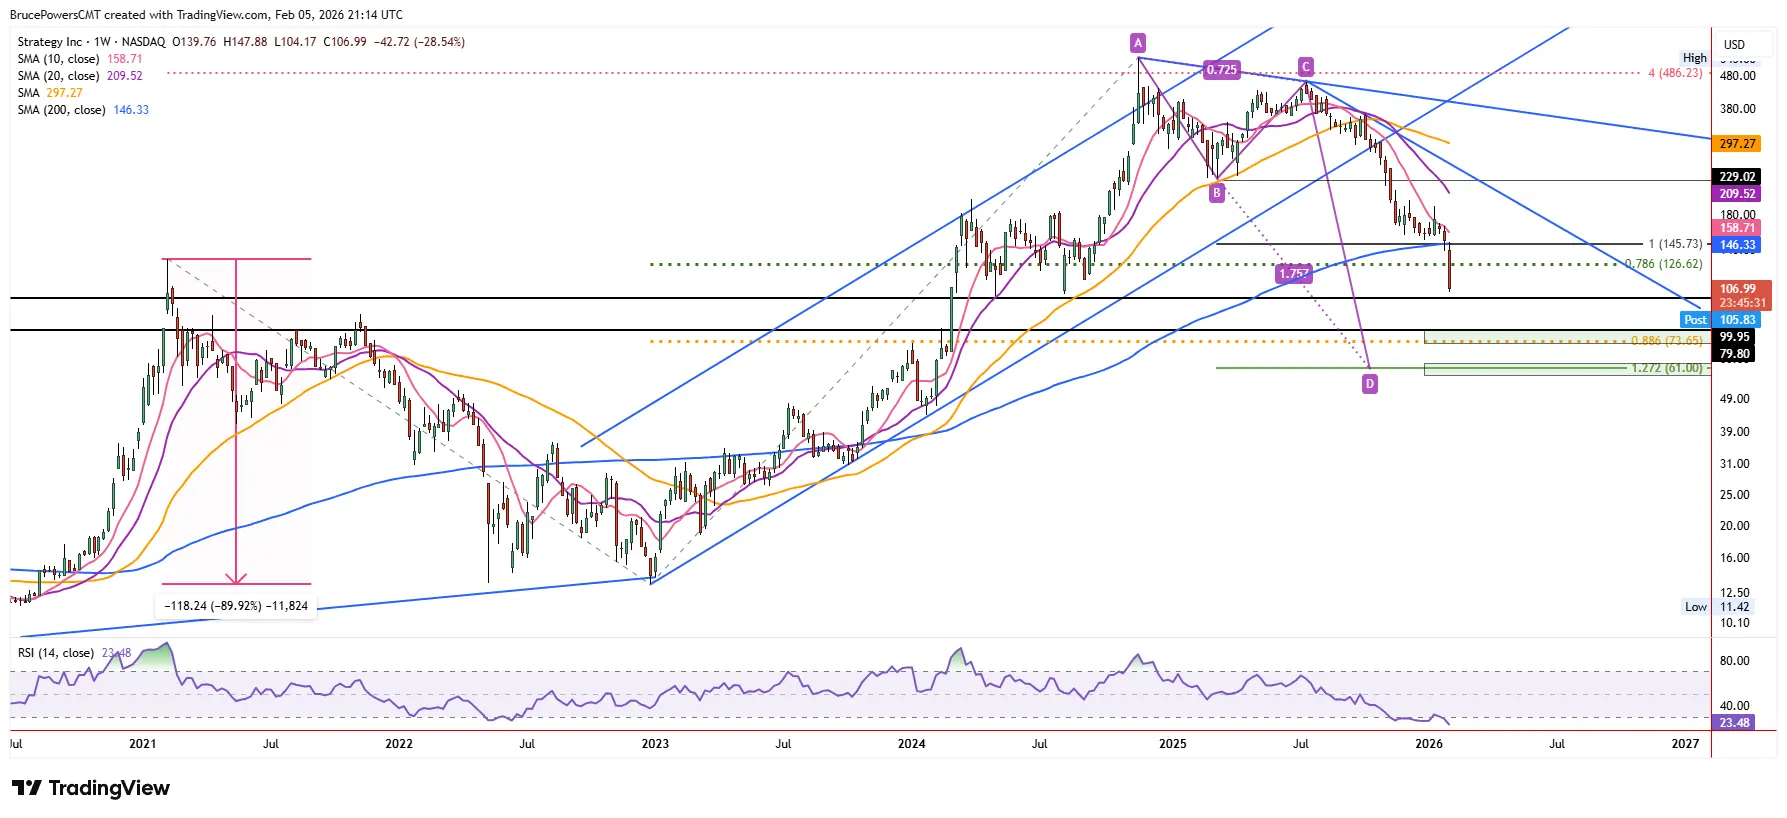
(Source: Trading View)
MicroStrategy’s stock continues to be dominated by sellers, with further declines expected. This week, MSTR broke through key trend support levels, falling below the 200-week and 50-month moving averages. It remains near the weekly low of $104.17, with a clear downward momentum. These two moving averages are highly significant in technical analysis, representing the boundary of ultra-long-term trends.
The 200-week moving average roughly corresponds to a 4-year price average, smoothing out medium- and short-term fluctuations and reflecting the long-term trend direction of the asset. For a highly volatile stock like MSTR, the 200-week MA has historically served as a “last line of defense.” During the March 2020 pandemic crash, MSTR briefly fell below this line but quickly recovered, initiating a multi-year bull market. Falling below again now, without a swift recovery, could mark the end of the long-term upward trend.
The 50-month moving average, representing about 4 years of monthly trend, is even smoother and more stable. When the price breaks below this line, it typically indicates that years of accumulated upward momentum have been exhausted, and the market is entering a long-term correction phase. The simultaneous breakdown of both key moving averages is a major technical disaster, signaling that the bulls have lost control.
Despite the Relative Strength Index (RSI) reaching oversold levels not seen since March 2020, lower targets may still be tested before the correction completes. The oversold RSI in March 2020 occurred during extreme pandemic panic, followed by a rapid rebound. Currently, the oversold condition is happening amid Bitcoin’s continued weakness and doubts about MicroStrategy’s business model, making the rebound less solid than in 2020. Historically, RSI oversold conditions can persist for weeks or even months, during which prices may continue to decline or trade sideways at low levels.
Triple Technical Breakdown for MSTR
Break of the 200-week MA: signals end of long-term uptrend
Break of the 50-month MA: indicates exhaustion of multi-year momentum
Weekly low of 104.17 testing repeatedly: no signs of short-term rebound
$146 Resistance and Death Cross Formation
While a short-term rebound may occur, the overall trend remains bearish. It is expected that any rally will face resistance and retreat until potential bottom signals emerge. The 200-week moving average at $146.35 is a critical resistance level, with the weekly low of $147.88 also serving as an important resistance. Above that is the 10-week moving average, which currently sits at $159 and is trending downward.
A key technical event is the 10-week MA approaching a death cross below the 200-week MA. When a short-term moving average crosses below a long-term one, it forms a “death cross,” a classic bearish signal that often indicates the start or continuation of a trend decline. Once the death cross occurs, the area around $146 will become a dense zone of moving averages, creating very strong resistance. Any attempt at a rebound into this zone may encounter heavy selling pressure and be rejected.
For bottom-fishing investors, this technical setup offers clear risk management guidance. Buying near the current price of $104 should involve setting a stop-loss below $100, with profit targets below $146 (as that level is likely to break down). Although the risk-reward ratio (about $4 stop vs. $40 profit) seems acceptable, the overall bearish technical picture suggests a success probability below 30%, making the expected value negative.
Key Support at 102-101 and Extreme Target of $80
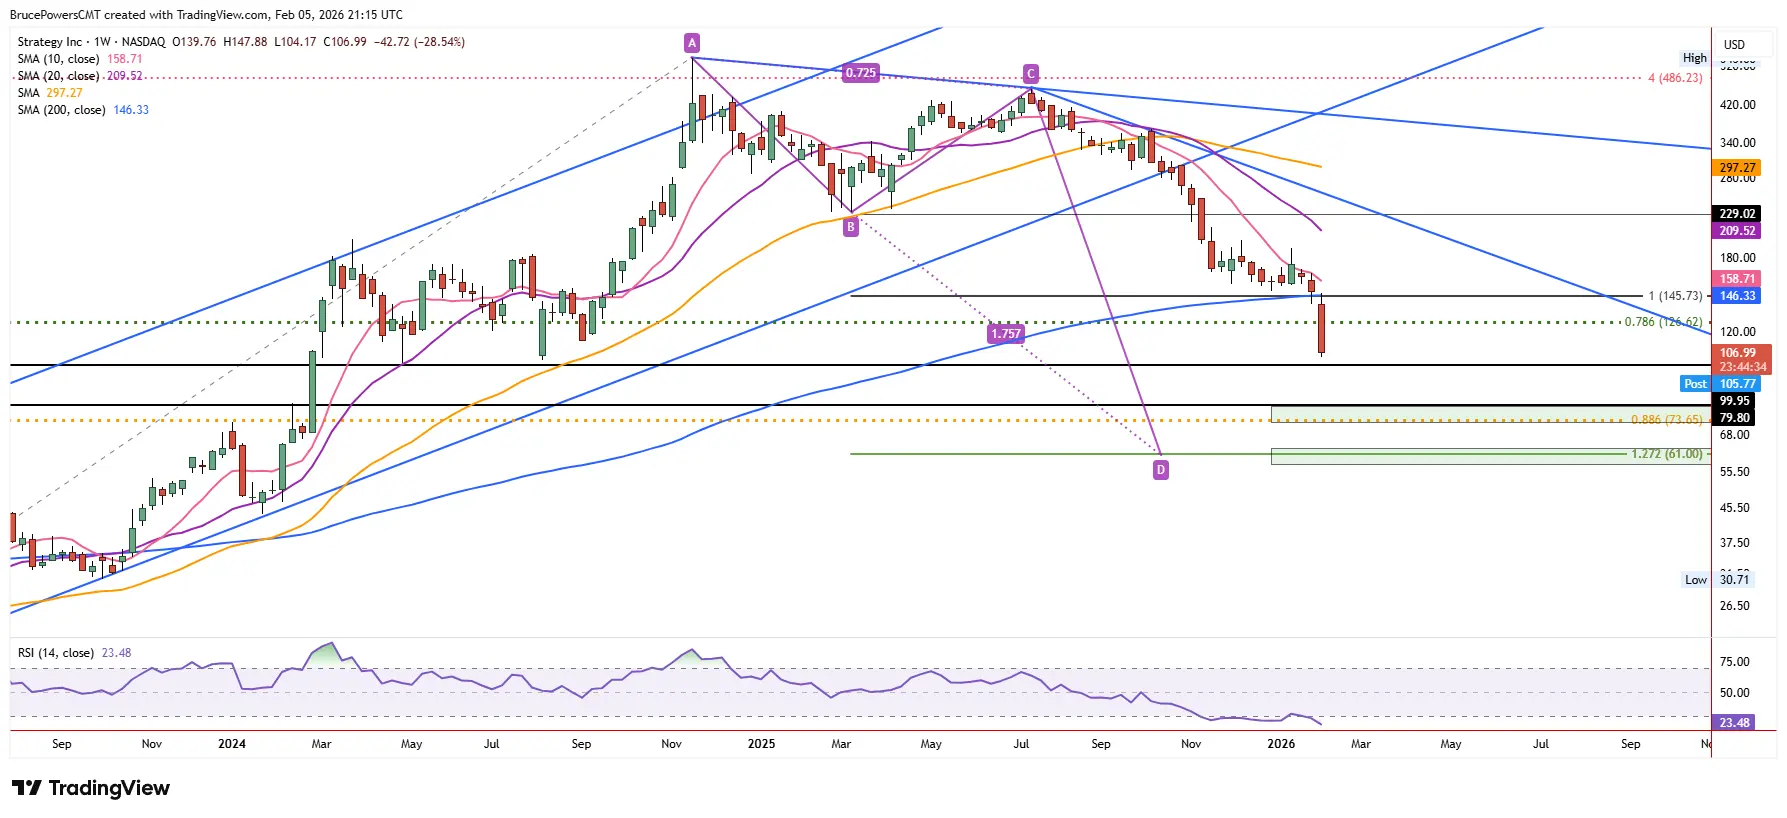
(Source: Trading View)
The next support zone appears near the lows of last year’s short-term consolidation, between $102.40 and $101.00. The high in 2021 also points to this price area. However, the lower target prices and the failure of the long-term 200-week MA support suggest that this correction could extend further downward.
The $102-101 zone is a confluence of multiple technical factors. It marks the lows of the 2025 short-term consolidation, representing the last effective support in recent times. It also approaches the early 2021 bull market high, where previous resistance turned support could come into play again. Psychologically, $100 is a key round number; breaking below it could trigger more panic.
If the next potential support zone is breached, MSTR could quickly fall toward around $80. During most of 2021, this level acted as resistance. Monitoring this area, along with the 88.6% Fibonacci retracement of the previous rally from the 2022 low of $73.65, can provide support signals. Generally, if the 88.6% retracement fails, the bullish outlook becomes even less likely.
Looking further down, the chart’s ABCD decline pattern indicates that the previously projected 127.2% retracement at $61 has been reached. The first target at 100% of the pattern is $145.73, which has already been achieved. The second wave of decline (CD) matches the first wave (AB), which started from the high of $543 in November. The market seems to have recently recognized this critical level, as it coincides with the 200-day moving average. Before this week’s support breakdown, the stock experienced a ten-week sideways consolidation, testing support multiple times.
The ABCD pattern is a classic technical analysis tool, assuming market movements follow certain mathematical regularities, with the second wave often similar in magnitude to the first. If valid, the decline from $543 to the current $104 has completed most of its fall, but the extreme target of $61 remains possible. This would imply an approximately 89% drop from the high, comparable to the 2022 bear market decline.
Disclaimer: The information on this page may come from third parties and does not represent the views or opinions of Gate. The content displayed on this page is for reference only and does not constitute any financial, investment, or legal advice. Gate does not guarantee the accuracy or completeness of the information and shall not be liable for any losses arising from the use of this information. Virtual asset investments carry high risks and are subject to significant price volatility. You may lose all of your invested principal. Please fully understand the relevant risks and make prudent decisions based on your own financial situation and risk tolerance. For details, please refer to
Disclaimer.
Related Articles
Yesterday, US Ethereum spot ETF had a net inflow of $3.82 million, with Fidelity FETH contributing the main inflow.
Gate News Report, March 11 — According to crypto analyst Trader T's monitoring, on March 10, the US Ethereum spot ETF saw a net inflow of $3.82 million. Among them, Fidelity's FETH had the most significant net inflow of $16.22 million; 21Shares' TETH had a net inflow of $1.01 million; Grayscale's
GateNews9m ago
Yesterday, US Bitcoin spot ETF net inflow was $218.66 million, with BlackRock IBIT accounting for over 70%.
On March 10th, the US Bitcoin spot ETF saw a net inflow of $218.66 million, with BlackRock IBIT accounting for 70.2%. Other funds such as Fidelity FBTC, Bitwise BITB, and others also experienced varying degrees of net inflows.
GateNews9m ago
Micron Technology closes up 3.5%, Continue Capital related address MU long position floating profit of $400,000
On March 11, Nvidia and Micron Technology stocks rose, with Micron up 3.54% to $403, and MU perpetual contracts also increased by 4.3% to $410.2. An address holds $14.6 million in semiconductor long positions, including $6.2 million in 7x leveraged MU positions, with unrealized gains of $400,000.
GateNews16m ago
TACO Trading Fails? Iran Deploys Mines, JPMorgan Warns of Unpredictable Risks
The article discusses the "TACO trading" strategy, where investors bet that President Trump will make concessions during a crisis. However, this assumption is challenged as Iran lays mines in the Strait of Hormuz. JPMorgan strategists warn that geopolitical uncertainty is increasing and recommend investors shift to infrastructure assets to reduce risk, as these assets tend to have more stable income and can provide protection in turbulent markets.
MarketWhisper27m ago
73% of Americans in financial distress are turning to cryptocurrencies, with financial nihilism sweeping Generation Z
Research shows that 73% of Americans using cryptocurrencies gamble due to financial hardship, with the rate among Generation Z reaching 80%. As high living costs and traditional savings methods become ineffective, investing in high-risk assets is seen as a way to pursue financial goals. The appeal of cryptocurrencies comes from the hope of improving one's situation rather than pure greed.
MarketWhisper59m ago
Gate Daily (March 11): SEC and CFTC sign Memorandum of Understanding; US requests re-examination of Tornado Cash co-founders
Bitcoin (BTC) is currently maintaining a price of around $70,000. The Chairman of the U.S. Securities and Exchange Commission (SEC) announced that they will coordinate with the Commodity Futures Trading Commission (CFTC) for joint meetings regarding product applications. Additionally, the case of Tornado Cash co-founder Roman Storm will be retried. The market is volatile due to geopolitical influences, and investor sentiment is poor, but a significant decline in the short term is unlikely.
MarketWhisper1h ago