
Key Takeaways
-
Avalanche (AVAX) has dropped over 16% in the past week, reflecting broader market weakness.
-
The 4H chart shows a Bullish Shark harmonic pattern, often associated with trend reversals.
-
Price is currently hovering near the $11.88 support, a critical zone for pattern validation.
-
If support holds, AVAX could rebound toward $13.39, with a higher upside target near $14.94.
-
A breakdown below the current support would invalidate the bullish setup and extend downside risk.
The cryptocurrency market remains under notable selling pressure as the total crypto market capitalization slipped 1.79% over the past 24 hours. This broader pullback triggered heightened volatility across digital assets, leading to more than $807 million in liquidations, with long positions bearing the brunt of the losses.
This wave of downside pressure has spilled into major altcoins, including Avalanche (AVAX). The token is trading slightly in the red and has dropped over 16% in the past seven days. However, beyond the red candles, AVAX’s chart is beginning to reveal a technical structure that suggests downside momentum may be weakening — and a rebound could be forming.
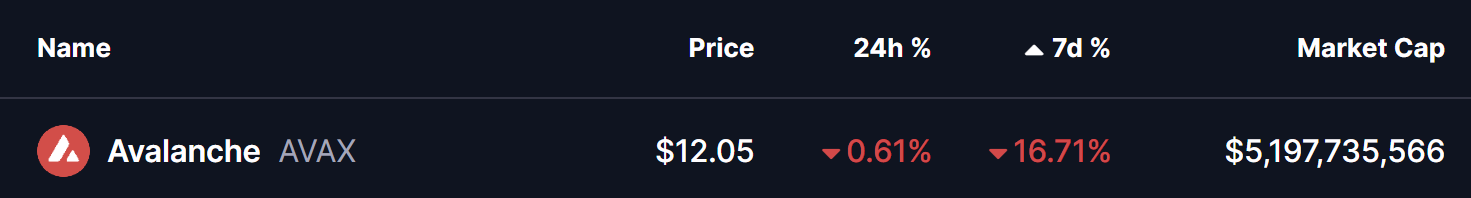
Source: Coinmarketcap
Harmonic Pattern Hints at Potential Upside
On the 4-hour timeframe, AVAX appears to be completing a Bullish Shark harmonic pattern, a formation that often emerges near market lows when selling pressure becomes exhausted. This pattern typically signals a potential trend reversal once its final leg forms within a defined demand zone.
The structure began with the initial O–X impulse around the $12.22 area, followed by a sharp rally that peaked near $14.83 at point X. Price then retraced aggressively toward point A before making another push higher to form point B near $14.94. That move, however, failed to sustain, triggering the current corrective leg.
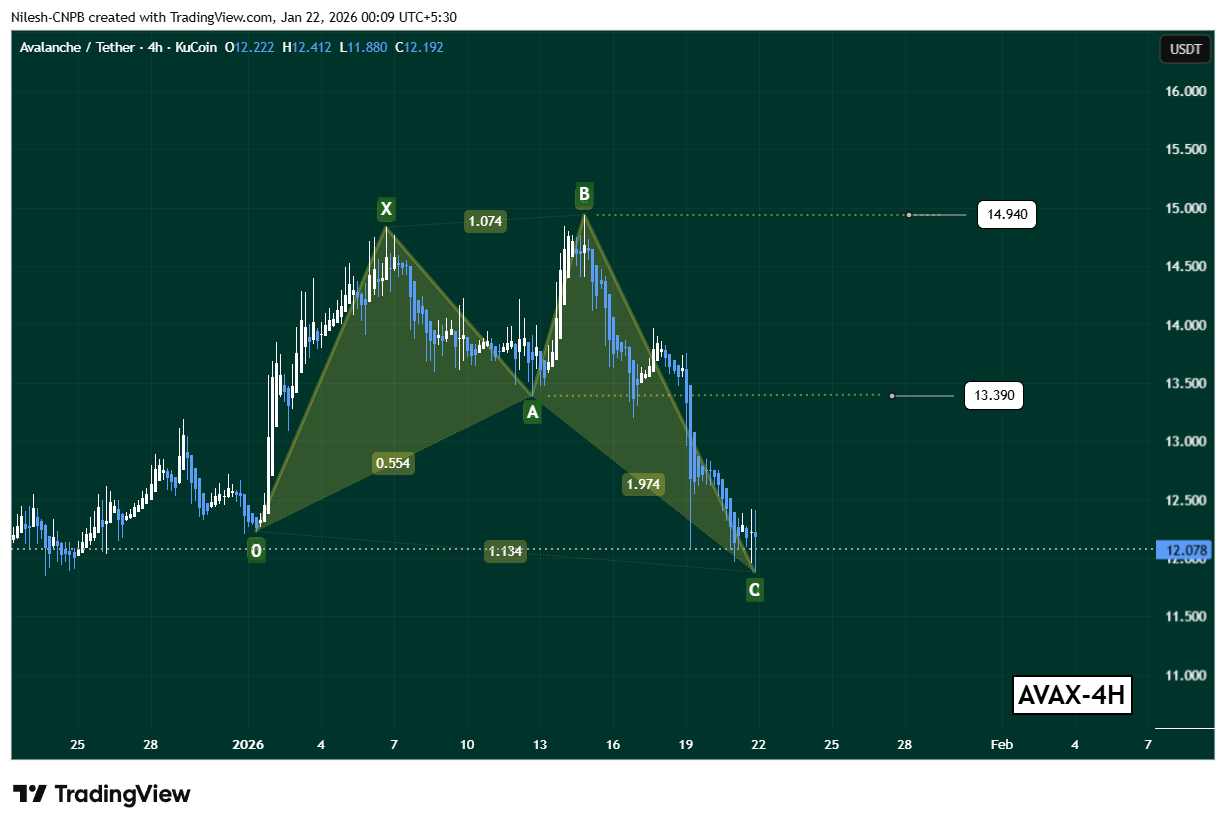
Avalanche (AVAX) 4H Chart/Coinsprobe (Source: Tradingview)
AVAX has since slid steadily lower, with price now hovering near $11.88, a level that could represent the C-point completion of the Shark pattern. This zone is technically important, as it’s where buyers often step in if the pattern is to play out bullishly.
What’s Next for AVAX?
If this harmonic structure continues to unfold as expected, AVAX could be positioning for a rebound from current levels. The first key upside level to watch sits around $13.39, which aligns closely with the prior A-point of the formation and serves as a near-term recovery target.
A stronger bullish follow-through could eventually bring the $14.94 region back into focus — the B-leg high and a significant resistance zone where sellers previously stepped in.
That said, the bullish outlook remains conditional. A sustained breakdown below the $11.88 support zone would invalidate the Shark pattern and shift momentum back in favor of the bears, opening the door for further downside continuation.
Bottom Line
AVAX may still be under pressure, but the emerging Bullish Shark harmonic pattern suggests selling momentum could be nearing exhaustion. As long as price holds above the current support zone, the setup favors a short-term rebound toward $13.39 and potentially $14.94. However, confirmation will depend on buyer response at current levels — making the next few sessions critical for Avalanche’s near-term direction.
Disclaimer: The views and analysis presented in this article are for informational purposes only and reflect the author’s perspective, not financial advice. Technical patterns and indicators discussed are subject to market volatility and may or may not yield the anticipated results. Investors are advised to exercise caution, conduct independent research, and make decisions aligned with their individual risk tolerance.
About Author: Nilesh Hembade is the Founder and Lead Author of Coinsprobe, with over 5 years of experience in the cryptocurrency and blockchain industry. Since launching Coinsprobe in 2023, he has been providing daily, research-driven insights through in-depth market analysis, on-chain data, and technical research.
Disclaimer: The information on this page may come from third parties and does not represent the views or opinions of Gate. The content displayed on this page is for reference only and does not constitute any financial, investment, or legal advice. Gate does not guarantee the accuracy or completeness of the information and shall not be liable for any losses arising from the use of this information. Virtual asset investments carry high risks and are subject to significant price volatility. You may lose all of your invested principal. Please fully understand the relevant risks and make prudent decisions based on your own financial situation and risk tolerance. For details, please refer to
Disclaimer.
Related Articles
HYPE Hits $35.53 After 2.4% Jump — Will Momentum Hold as Price Tests $35.59 Resistance?
Hyperliquid’s HYPE trades at $35.53, approaching the $35.59 resistance after a 2.4% daily gain.
The chart shows the $33.67 zone acting as support after price moved above a previously contested level.
Price now trades between $33.67 support and $35.59 resistance, shaping the immediate
CryptoNewsLand7m ago
TAO Price Pumps Another 20% as Bittensor Delivers What No Other AI Crypto Could
Bittensor's TAO token surged 20% today, achieving over 60% gains in the last month, following the completion of a groundbreaking decentralized language model. Market sentiments are high, signaling strong investor interest in Bittensor's technology.
CaptainAltcoin32m ago
BTC 15分钟下跌0.67%:宏观避险情绪与衍生品去杠杆共振放大卖压
2026年3月13日15:30至15:45(UTC),比特币(BTC)在71886.1至72602.0 USDT区间震荡,振幅0.99%,最终15分钟内下跌0.67%。该时段成交量较前一小时显著放大,多头仓位出现集中止损,短线波动引发市场高度关注,情绪维持极度谨慎。
本次异动的主要驱动力在于全球地缘政治局势紧张和通胀预期走高。美国与伊朗冲突升级导致布伦特原油价格维持在100美元/桶以上,市场对
GateNews46m ago
BTC 15分钟下跌1.06%:油价冲击与杠杆强平共振引发抛售压力
2026-03-13 14:30 至 14:45(UTC),BTC在15分钟内收益率录得-1.06%,K线价格区间为72933.4至73896.0 USDT,振幅达1.31%。短时间市场波动明显加剧,交易活跃度与关注度同步走高。
本次异动的主要驱动力是全球油价因美以对伊朗军事行动急飙至100美元上方,触发通胀预期升温和美联储降息可能性的下降,导致全球风险偏好大幅回撤。比特币作为流动性最强的风险
GateNews1h ago
Bitcoin Shows Value Bottom Signals but True Market Floor Missing
Bitcoin is at a "Value Bottom" ideal for long-term dollar-cost averaging, but has not yet reached a "Structural Bottom," leading to projected volatility between $60K-$70K. Investors should prepare for continued fluctuations and potential buying opportunities.
BlockChainReporter2h ago
Bitcoin Trades Narrow Range As Resistance Holds Near $71K
Bitcoin is trading around $70,335, showing a 2.13% decline in 24 hours. Analysts note a resistance near $71,400 and a consolidation phase, with traders awaiting a decisive breakout above or below established support and resistance levels.
CryptoBreaking2h ago