
Key Takeaways
-
Canton (CC) surged over 13%, outperforming the broader crypto market amid widespread weakness.
-
The daily chart confirms a Cup and Handle breakout, a bullish reversal pattern.
-
CC has broken above the handle resistance near $0.1413, signaling early bullish momentum.
-
The key neckline resistance lies between $0.1586–$0.1685, which remains the next major hurdle.
-
A successful breakout above the neckline could open the door for a measured move toward $0.2752.
Canton Coin (CC), the native utility token of the Canton Network — a privacy-enabled public Layer-1 blockchain — is quietly stepping into the spotlight. While the broader crypto market remains under pressure, CC is flashing relative strength, posting an impressive 13% daily gain and standing out among largely red charts.
Beyond the price jump, what’s drawing attention is the technical structure forming on the daily timeframe, which now suggests that CC may be entering the early stages of a larger bullish move.
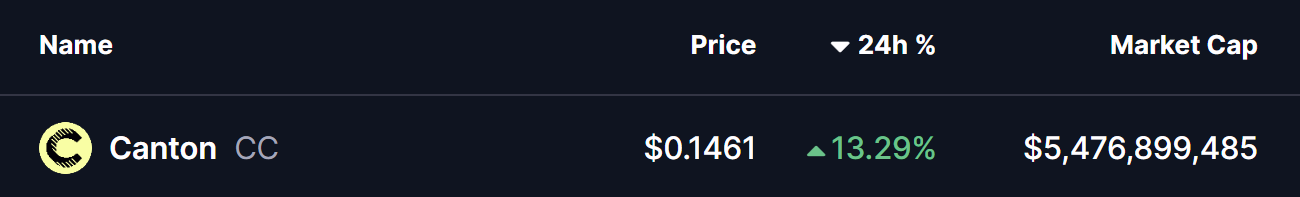
Source: Coinmarketcap
Cup and Handle Breakout Signals Trend Shift
On the daily chart, Canton has completed a textbook Cup and Handle formation, a bullish reversal pattern that often marks the transition from accumulation into trend continuation.
The “cup” portion of the pattern began forming in November, following a sharp rejection from the $0.1586–$0.1685 resistance zone. Price then sold off aggressively, eventually bottoming near $0.062, before gradually rounding out — a sign that selling pressure was fading and buyers were slowly regaining control.
After the rounded base was established, CC entered the “handle” phase, characterized by a short-term downward channel and lower volatility. This phase typically shakes out weak hands before the next move higher.
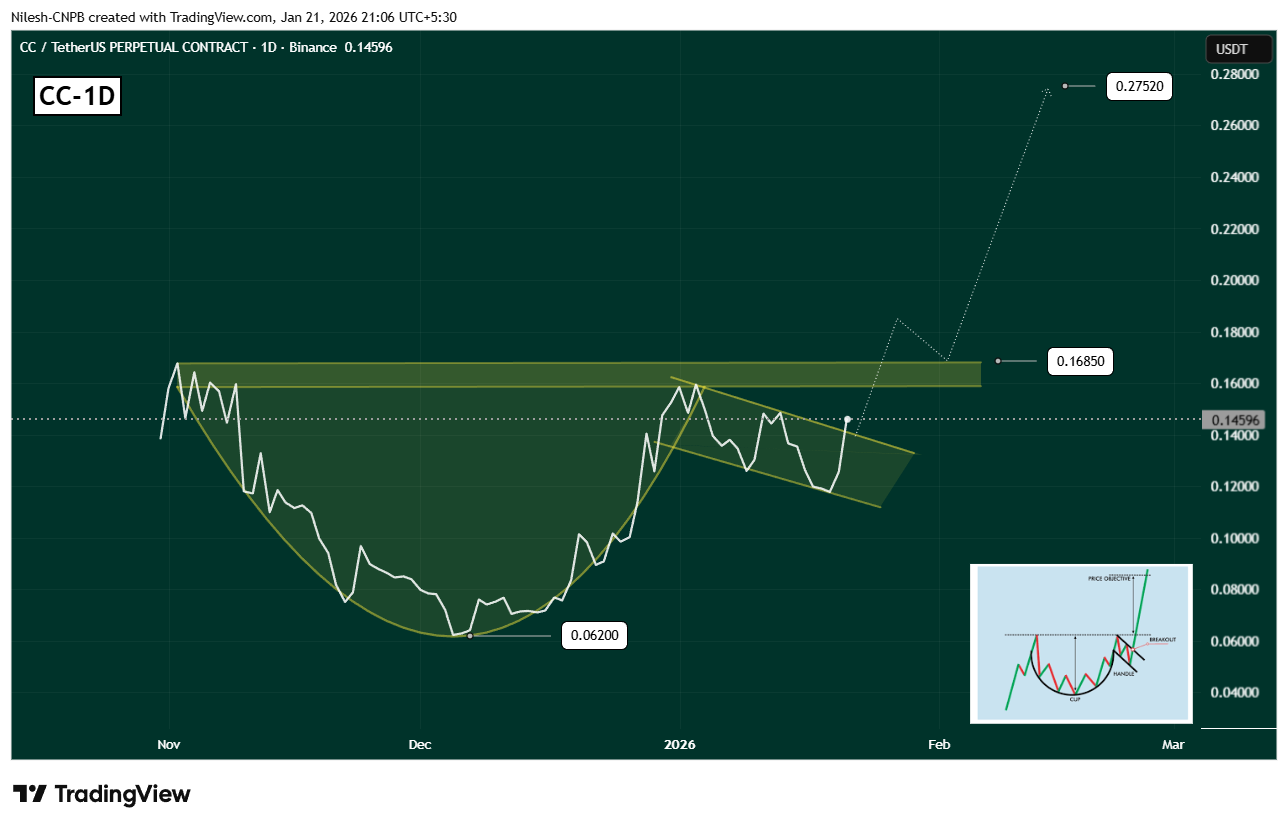
Canton (CC) Daily Chart/Coinsprobe (Source: Tradingview)
That breakout has now arrived.
Price has pushed decisively above the handle resistance near $0.1413, signaling renewed bullish momentum and offering an early indication that the broader pattern may be resolving to the upside.
Momentum Builds Despite Market Weakness
What makes this breakout more notable is the context. CC is advancing while the broader market remains cautious, suggesting relative strength and selective accumulation rather than a purely market-driven bounce.
As long as price holds above the former handle resistance, the breakout structure remains intact and favors continuation rather than immediate rejection.
What Could Come Next for CC?
With the handle breakout done, attention now shifts to the neckline resistance zone between $0.1586 and $0.1685. This area previously acted as strong supply and will likely be the next major test for bulls.
A successful breakout and daily close above this zone would confirm the Cup and Handle pattern and potentially unlock a measured move toward the $0.275 area, based on the depth of the cup formation.
Until that happens, CC may pause or consolidate near current levels, but the overall structure continues to lean bullish as long as price remains above the breakout zone.
For now, Canton Coin appears to be transitioning from accumulation into expansion — and if momentum continues to build, CC could be setting up for a much larger move in the sessions ahead.
Disclaimer: The views and analysis presented in this article are for informational purposes only and reflect the author’s perspective, not financial advice. Technical patterns and indicators discussed are subject to market volatility and may or may not yield the anticipated results. Investors are advised to exercise caution, conduct independent research, and make decisions aligned with their individual risk tolerance.
About Author: Nilesh Hembade is the Founder and Lead Author of Coinsprobe, with over 5 years of experience in the cryptocurrency and blockchain industry. Since launching Coinsprobe in 2023, he has been providing daily, research-driven insights through in-depth market analysis, on-chain data, and technical research.
Disclaimer: The information on this page may come from third parties and does not represent the views or opinions of Gate. The content displayed on this page is for reference only and does not constitute any financial, investment, or legal advice. Gate does not guarantee the accuracy or completeness of the information and shall not be liable for any losses arising from the use of this information. Virtual asset investments carry high risks and are subject to significant price volatility. You may lose all of your invested principal. Please fully understand the relevant risks and make prudent decisions based on your own financial situation and risk tolerance. For details, please refer to
Disclaimer.
Related Articles
XRP Price Structure Tightens While Heatmap Highlights $1.30 Liquidity Zone
XRP trades near $1.37 support after a 0.9% daily decline, while the $1.44 level remains the immediate resistance in the current range.
A three-week liquidity heatmap highlights a large order cluster around $1.30, indicating a strong liquidity zone below price.
A three-month Gaussian
CryptoNewsLand19m ago
Internet Computer Price Nears Wedge Breakout — Will Momentum Hold Above $2.54?
Internet Computers continues trading within a falling wedge that has developed since November. Price now approaches the pattern’s upper boundary as volatility tightens.
ICP is trading around the $2.57 mark which is a bit higher than the $2.54 support. In the meantime, the immediate
CryptoNewsLand24m ago
Billionaire Investor Stanley Druckenmiller Bullish on Stablecoin Growth
Billionaire investor Stanley Druckenmiller believes stablecoins will become the backbone of the financial system in 10-15 years, citing their efficiency. However, he views much of the wider crypto market as unnecessary, describing it as “a solution looking for a problem.”
Decrypt44m ago
Bitcoin Cash Battles $459 Resistance as Massive Sell Walls Stack Toward $650
BCH is trading at $455.86 close to the resistance range of $459.20 with the support level of $447.44.
The chart data indicates that the chart has strong resistance levels at around $520, $580 and $650 which restricts the momentum on short term upside.
Following a sharp fall, price
CryptoNewsLand1h ago
PEPE Consolidates Above $0.05324 Support as Momentum Strengthens and Resistance Near $0.05336 Holds
PEPE has a tight intraday price compression with a support level of $0.053243 and resistance level of $0.053363.
A RSI of 64.13 represents the moderate bullish momentum whereas MACD history is slightly positive, which indicates the gradual buying momentum.
The price is at $0.053364
CryptoNewsLand2h ago
HYPE Hits $35.53 After 2.4% Jump — Will Momentum Hold as Price Tests $35.59 Resistance?
Hyperliquid’s HYPE trades at $35.53, approaching the $35.59 resistance after a 2.4% daily gain.
The chart shows the $33.67 zone acting as support after price moved above a previously contested level.
Price now trades between $33.67 support and $35.59 resistance, shaping the immediate
CryptoNewsLand2h ago