
Key Takeaways
-
Hyperliquid (HYPE) surged over 8%, reclaiming the $23.30 level amid rising market interest.
-
DefiLlama data shows Hyperliquid leading perpetual futures volume over the last 30 days, topping $160 billion.
-
Strong derivatives activity suggests sustained trader demand and growing ecosystem traction.
-
The daily chart highlights a Bearish Shark harmonic pattern, allowing room for short-term upside.
Hyperliquid’s native token, HYPE, is back in the spotlight today after posting a 8%+ price jump, pushing above the $23.30 level. While the price move itself has caught traders’ attention, a deeper look at on-chain metrics and the daily chart suggests there may be more developing beneath the surface.
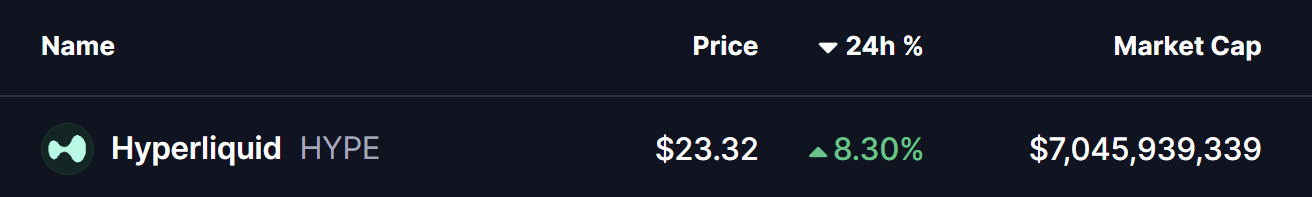
Source: Coinmarketcap
Hyperliquid (HYPE) Leads Perp Volume
According to DefiLlama data, **Hyperliquid **has emerged as the **top perpetual futures **platform by trading volume over the last 30 days, significantly outperforming its closest competitors. The protocol recorded approximately $160.4 billion in perpetual volume, comfortably ahead of Aster and Lighter, which logged around $124.7 billion and $112.5 billion, respectively.
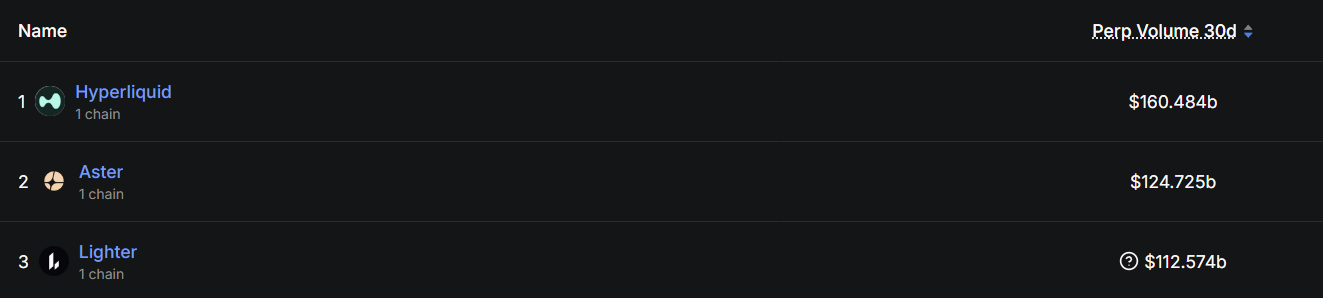
Source: Defillama
This surge in activity highlights growing trader preference for Hyperliquid’s ecosystem, signaling strong demand, deep liquidity, and sustained engagement. Historically, rising derivatives volume often acts as a leading indicator for increased interest in a project’s native token — something that appears to be playing out in HYPE’s recent price action.
Is More Upside Ahead?
From a technical perspective, HYPE’s daily chart reveals the development of a Bearish Shark harmonic pattern, a well-known formation in technical analysis. While this pattern ultimately suggests a potential reversal once fully completed, it often allows for short-term bullish continuation as price moves toward the “C” point.
Following the completion of the O-X-A-B structure, HYPE is currently trading around $23.26, holding above its recent lows. The next key challenge for bulls lies at the 50-day moving average near $25.72, which has acted as a dynamic resistance zone.
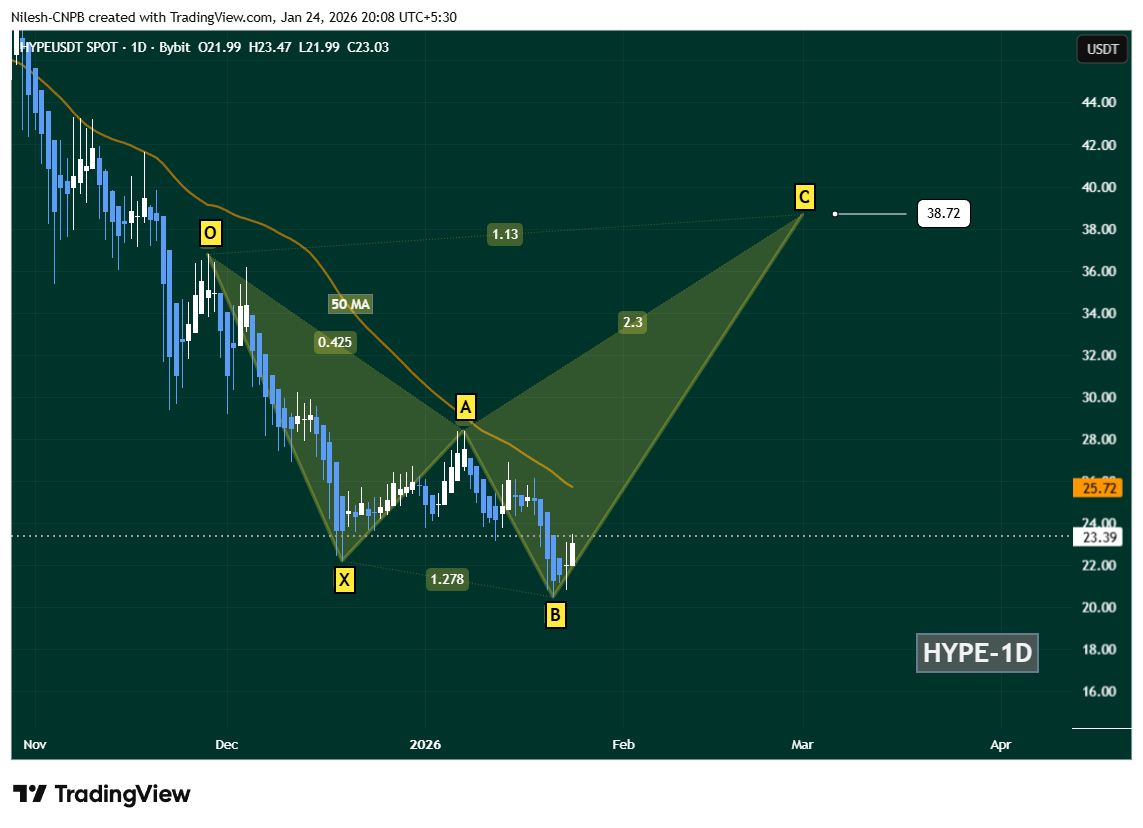
Hyperliquid (HYPE) Daily Chart/Coinsprobe (Source: Tradingview)
A decisive daily close above the 50-day MA ($25.72) would strengthen the recovery narrative and could open the door for a broader upside move. If momentum continues to build, the chart projects a potential advance toward the C-point near $38.72, aligning with the Shark pattern’s 1.13 Fibonacci extension.
However, downside risks remain. A failure to hold the B-point support zone would invalidate the bullish continuation setup and could expose HYPE to extended consolidation or further downside pressure in the near term.
Bottom Line
HYPE’s price rebound is being backed by strong on-chain fundamentals, with Hyperliquid clearly dominating the perpetual trading landscape. While the broader harmonic structure suggests caution in the longer term, short-term technicals still favor a recovery move as long as key support levels remain intact. All eyes now remain on the $25.72 reclaim, which could act as the trigger for the next leg higher.
Disclaimer: The views and analysis presented in this article are for informational purposes only and reflect the author’s perspective, not financial advice. Technical patterns and indicators discussed are subject to market volatility and may or may not yield the anticipated results. Investors are advised to exercise caution, conduct independent research, and make decisions aligned with their individual risk tolerance.
About Author: Nilesh Hembade is the Founder and Lead Author of Coinsprobe, with over 5 years of experience in the cryptocurrency and blockchain industry. Since launching Coinsprobe in 2023, he has been providing daily, research-driven insights through in-depth market analysis, on-chain data, and technical research.
Disclaimer: The information on this page may come from third parties and does not represent the views or opinions of Gate. The content displayed on this page is for reference only and does not constitute any financial, investment, or legal advice. Gate does not guarantee the accuracy or completeness of the information and shall not be liable for any losses arising from the use of this information. Virtual asset investments carry high risks and are subject to significant price volatility. You may lose all of your invested principal. Please fully understand the relevant risks and make prudent decisions based on your own financial situation and risk tolerance. For details, please refer to
Disclaimer.
Related Articles
Dogecoin Tests Fibonacci Barrier as Weak Momentum Builds Risk
Key Insights
Dogecoin price approaches a confluence of Fibonacci resistance and value area high, creating a strong technical barrier that traders closely monitor.
The latest rally shows weakening momentum, suggesting the upward move may rely more on liquidations than sustained buying
CryptoFrontNews10m ago
Is this the perfect buying point for Bitcoin? PlanB updates the S2F model: the average price in this cycle is expected to reach $500,000
Quantitative analyst PlanB has made a new Bitcoin forecast, estimating that the average price from 2024 to 2028 will reach $500,000, based on its S2F model. The model calculates scarcity through asset stock and annual production, indicating that the market is currently entering a buying opportunity. PlanB emphasizes the historical accuracy of the forecast but also acknowledges the model's blind spots and the need to pay attention to market demand changes.
区块客30m ago
Pump.fun signals multichain move on subdomains, MoonPay
Pump.fun multichain expansion: what current signals indicate now
according to Phemex News, Pump.fun has registered subdomains for Base, BSC, Monad, and Ethereum, a step widely read as groundwork for a broader rollout beyond Solana. Domain preparation can indicate technical planning and branding al
CoincuInsights36m ago
Silver-Togued Analyst Prepares for the Next Leg Down for BTC Between $44,000 – $57,000
Silver-tongued analyst prepares for the next leg down for BTC.
He expects BTC to drop twice into two specific bearish boxes.
The first will take the price of BTC to $57,000, and the next below $50,000.
The crypto community clings to bullish hope as the price of Bitcoin (BTC), the
CryptoNewsLand1h ago
MICA Daily|Exchange liquidity dries up, BTC trend continues to weaken
The latest US CPI data released aligns with market expectations, but due to the impact of the Middle East situation, market reactions are muted. The US stock indices fluctuate, and BTC prices hover around $70,000. Although it appears stable in the short term, market sentiment remains pessimistic, and whether the price can stay above $70,000 in the future remains uncertain, mainly depending on the development of the Middle East situation. Meanwhile, Binance's net flow data shows that investors withdraw BTC during market downturns, but selling pressure still exists.
区块客1h ago
BitMine is sweeping up 60,000 ETH! Tom Lee confidently states: "The mini crypto winter" is coming to an end.
Bitmine Immersion Technologies recently purchased 60,976 Ethereum, totaling approximately $120 million, to support the crypto market. Despite facing $7.8 billion in unrealized losses, Chairman Tom Lee remains actively buying, believing the market is close to the bottom. The company plans to stake all its Ethereum, with an estimated annualized return of $259 million, urging investors to seize the bottoming opportunity.
区块客2h ago