Hyperliquid (HYPE) is leading the market today after jumping more than 25% in the past day. The HYPE price is now trading around $27.83, while trading volume has surged by over 120%, making HYPE the top gainer across major exchanges.
This move is not coming out of nowhere. Both on-chain activity and derivatives data point to a sharp rise in real usage on the Hyperliquid platform.
- Why HYPE Price is pumping
- What the Hyperliquid Chart is showing
- What Market indicators are saying
- Short-term outlook for HYPE Price
Why HYPE Price is pumping
Open interest on Hyperliquid’s HIP-3 network just hit a new record near $790 million, driven mainly by heavy trading in gold and silver perpetuals. Traders rotated into commodities as markets turned cautious, pushing activity on Hyperliquid higher.
More open interest means more capital flowing through the platform and more fees being generated. Since Hyperliquid uses most of its fees for HYPE buybacks, higher activity directly feeds into demand for the token.
This milestone also shows that Hyperliquid’s model is gaining traction beyond crypto-only markets, which has pulled in fresh speculative interest over the past day. Spot volume has also confirmed the move. 24-hour spot trading volume jumped to around $520 million, showing that this is not just derivatives-driven noise.
That kind of volume usually points to real buying rather than thin liquidity moves. It suggests traders are actively positioning, not just chasing a quick wick. The platform’s CEO also added fuel by stating Hyperliquid is now the most liquid venue in crypto, which boosted confidence around the project during this breakout.
What the Hyperliquid Chart is showing
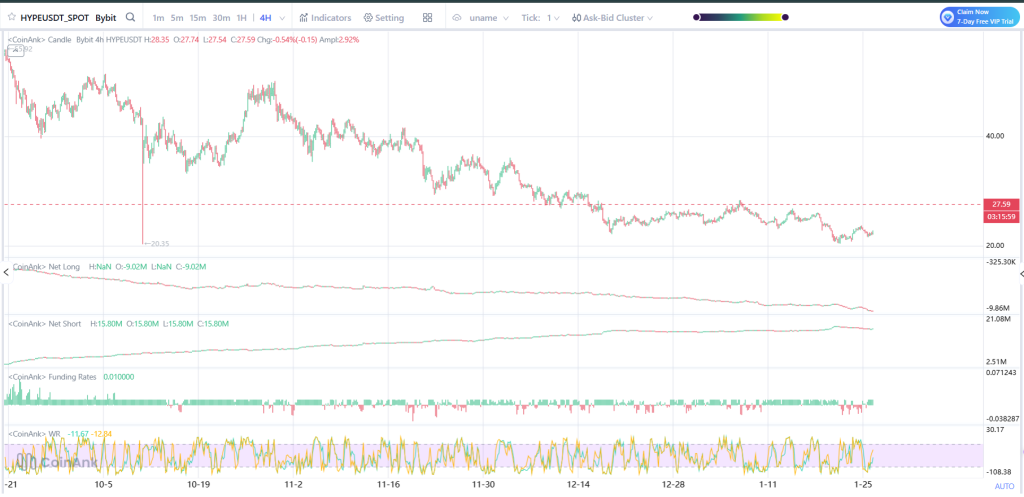
On the 4H chart, the HYPE price has broken out of its recent consolidation range and moved sharply higher in a short time. Price is now well above the previous resistance levels, which have now become short-term support.
This is accompanied by increasing volume, which further validates the breakout. So far, there are no signs of a strong rejection or long upper wicks on the candle chart, which indicates that the market is still in the hands of the buyers.
For now, the Hyperliquid price structure remains bullish as long as HYPE stays above the $25–$26 area, which marks the base of the breakout.
_****Gold and Silver Just Suffered a $1.7 Trillion Flash Crash—Here’s What Really Happened**
Source: Coinank
What Market indicators are saying
Net positioning shows short positions have been increasing steadily before the breakout, which probably means that this has now added fuel to the price once it broke out.
In terms of funding rates, it is slightly positive, which means that people are still willing to pay to be on the long side, but it is not at extreme levels.
Williams %R is close to overbought levels, which indicates that the price is moving very quickly. It is probably a good time to see some short-term consolidation.
Short-term outlook for HYPE Price
As long as volume remains elevated and open interest stays near current highs, HYPE has room to extend this move. The next area to watch on the upside sits around $30–$32.
A pullback toward $26–$25 would not damage the structure and could even provide a base for continuation. That zone is now key for bulls to defend.
If the HYPE price falls back below $25 on strong selling, that would be the first sign that momentum is fading and that the move may need more time to reset.
Disclaimer: The information on this page may come from third parties and does not represent the views or opinions of Gate. The content displayed on this page is for reference only and does not constitute any financial, investment, or legal advice. Gate does not guarantee the accuracy or completeness of the information and shall not be liable for any losses arising from the use of this information. Virtual asset investments carry high risks and are subject to significant price volatility. You may lose all of your invested principal. Please fully understand the relevant risks and make prudent decisions based on your own financial situation and risk tolerance. For details, please refer to
Disclaimer.
Related Articles
Gate Daily Report (April 27): Comments related to the Trump shooting incident boost the TRUMP coin; the U.S. Department of the Treasury will include Venmo in debt-inquiry donation payments
Bitcoin (BTC) sees a sharp short-term surge and rebound, temporarily trading at around $78,900 as of April 27. Trump’s provocative remarks about the shooting incident boosted the prices of meme coins such as TRUMP, MAGA, and DJT, because a carefully crafted narrative has once again come back into view. The U.S. Treasury has moved Venmo into the debt donation payment channel, after the previously strategic Bitcoin reserve bill stalled.
MarketWhisper3m ago
Ascending Triangle Breakout Loading? Top 5 Altcoins With 5x Upside Potential
Ascending triangles indicate growing buying pressure but need to be confirmed.
Toncoin and Fantom display better trends than others in consolidation.
Overall market conditions still play a crucial role in the success of breakouts.
A common technical pattern has begun to emerge among
CryptoNewsLand12m ago
Crypto Fear and Greed Index Rises to 47, Signaling Neutral Market Sentiment
Gate News message, April 27 — According to Alternative.me, the Crypto Fear and Greed Index stands at 47 today, indicating a neutral market sentiment. The index rose from 33 yesterday (April 26), reflecting a shift toward more balanced market
GateNews1h ago
Whale pension-usdt.eth's $110M Short on BTC and ETH Down $15.25M as April Rally Continues
Gate News message, April 27 — According to on-chain analyst Yujin's monitoring, whale pension-usdt.eth opened a 3x leveraged short position on $110 million worth of BTC and ETH near the start of April, but has since incurred a floating loss of $15.25 million as prices rallied throughout the month.
GateNews1h ago
BNB Price Steady Above $633 as Bulls Face Strong Barriers
Key Insights:
BNB holds above the 50-day EMA near $633, supported by whale activity, while mixed derivatives data keep price action within a consolidation range.
Technical indicators, including RSI and MACD, show mild bullish momentum, though strong resistance levels near $662 and $680
CryptoNewsLand6h ago
Chainlink Price Tightens as $10 Resistance Holds Firm
Key Insights:
Chainlink trades between $8.5 and $10 as a tightening range signals volatility expansion, with buyers showing early strength through higher lows formation.
Open interest drops to $380 million while persistent spot outflows indicate cautious sentiment, though declining selling p
CryptoNewsLand6h ago