
Key Takeaways
-
Zcash (ZEC) is trading near the $396–$397 range after losing momentum following a sharp 2025 rally.
-
The resignation of Zcash’s core development team triggered strong selling pressure and weakened market confidence.
-
The daily chart shows a descending triangle, a bearish continuation pattern signaling increasing seller control.
As of January 18, 2026,** Zcash (ZEC) **is trading around the $396–$397 range, extending its recent weakness with a nearly 2.5% drop over the last 24 hours. While the move may look modest on the surface, it reflects a broader shift in sentiment following ZEC’s explosive 2025 rally, where the privacy-focused coin surged more than 800% at its peak.
That momentum has clearly faded in early 2026, and both fundamentals and technicals are now flashing caution signals.
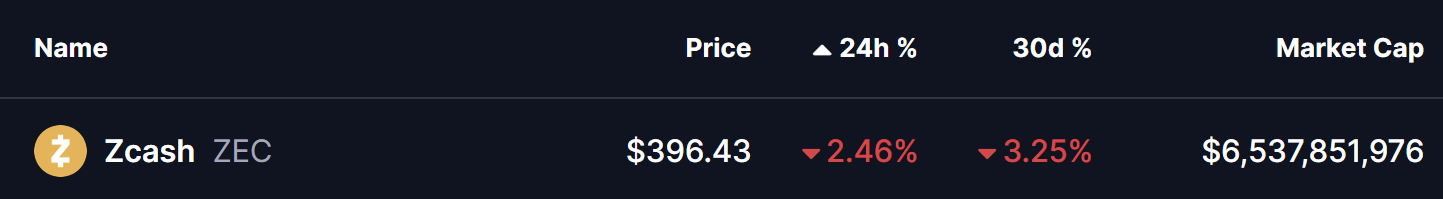
Source: Coinmarketcap
Developer Exodus Shakes Confidence
The biggest overhang for Zcash came earlier this month when the entire core development team at Electric Coin Company (ECC) stepped down. The resignations, which occurred around January 7–8, were linked to governance disputes with the Bootstrap nonprofit board overseeing the project.
Markets reacted swiftly. ZEC sold off sharply from the $480–$500 region, erasing weeks of gains in a matter of days. For a project built around long-term cryptographic research and privacy innovation, uncertainty around leadership and development direction has weighed heavily on investor confidence.
Descending Triangle Takes Shape
From a technical standpoint, Zcash’s daily chart now shows a clear descending triangle, a structure that typically signals bearish continuation after a strong uptrend.
The pattern is defined by:
-
A flat support zone between $300 and $335, which has repeatedly attracted buyers.
-
A series of lower highs, forming a downward-sloping resistance line from the 2025 peak near $750.
As price compresses within this triangle, volatility has steadily declined — often a precursor to a decisive move. Adding to the bearish bias, the 100-day moving average continues to cap upside attempts, acting as dynamic resistance during recent rebounds.
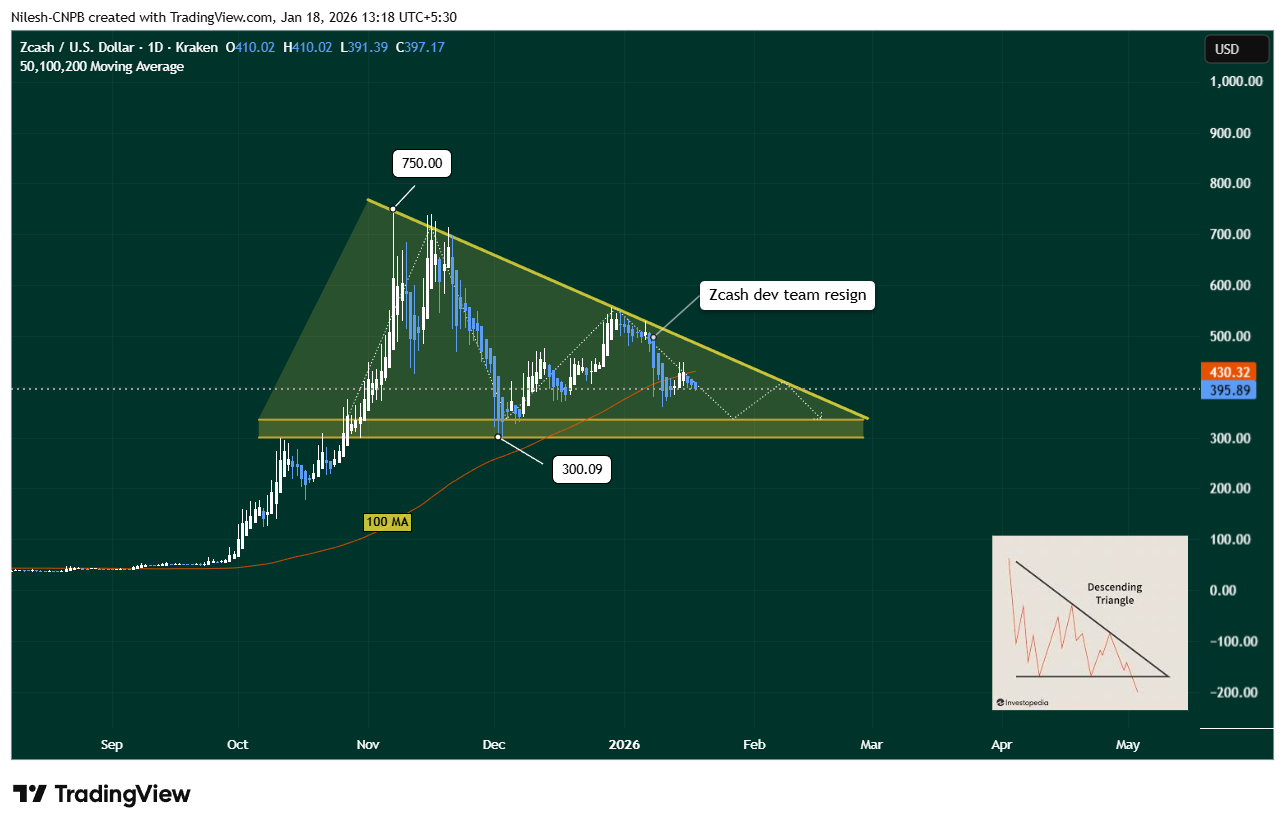
Zcash (ZEC) Daily Chart/Coinsprobe (Source: Tradingview)
The chart also highlights how the sharp sell-off began almost immediately after the developer resignation news, reinforcing the connection between fundamentals and technical weakness.
What’s Next for ZEC?
If bearish pressure persists, ZEC could gradually slide toward the lower boundary of the triangle, putting the $300–$335 support zone back in focus. A clean breakdown below this area would significantly weaken the structure and could trigger a deeper corrective phase.
On the flip side, bears would lose control if buyers manage to reclaim the 100-day moving average near $430. Such a move would signal renewed demand and could ease concerns tied to the descending triangle, at least in the short term.
Bottom Line
Zcash remains one of the most recognizable privacy-focused cryptocurrencies, but the current setup suggests caution. The combination of developer uncertainty and a bearish chart pattern has shifted momentum firmly in favor of sellers for now.
Until ZEC either breaks down from its descending triangle or reclaims key resistance levels, the token is likely to remain range-bound with a bearish tilt. How price behaves near the $300 support zone will be critical in defining Zcash’s next major move.
For traders and long-term holders alike, patience may be the best strategy as the market waits for clarity — both on the charts and within Zcash’s leadership structure.
Disclaimer: The views and analysis presented in this article are for informational purposes only and reflect the author’s perspective, not financial advice. Technical patterns and indicators discussed are subject to market volatility and may or may not yield the anticipated results. Investors are advised to exercise caution, conduct independent research, and make decisions aligned with their individual risk tolerance.
About Author: Nilesh Hembade is the Founder and Lead Author of Coinsprobe, with over 5 years of experience in the cryptocurrency and blockchain industry. Since launching Coinsprobe in 2023, he has been providing daily, research-driven insights through in-depth market analysis, on-chain data, and technical research.
Disclaimer: The information on this page may come from third parties and does not represent the views or opinions of Gate. The content displayed on this page is for reference only and does not constitute any financial, investment, or legal advice. Gate does not guarantee the accuracy or completeness of the information and shall not be liable for any losses arising from the use of this information. Virtual asset investments carry high risks and are subject to significant price volatility. You may lose all of your invested principal. Please fully understand the relevant risks and make prudent decisions based on your own financial situation and risk tolerance. For details, please refer to
Disclaimer.
Related Articles
Sonic Price May Experience Technical Reversal: RSI Bullish Divergence Emerges, $0.03 Becomes a Key Support Level
Sonic token recently found support at $0.03, and the RSI shows a bullish divergence, indicating weakening downside momentum. If the support remains effective, the price could rebound to $0.04. Both technical and fundamental analyses show positive signals, but if the key support is broken, bears may regain control.
GateNews3m ago
Ethereum funding rate turns negative! ETF outflows, staking yields are lower than stablecoins
Ethereum perpetual contract funding rates turn negative, indicating increased demand for shorts and a clear market bearish sentiment. Institutional demand remains weak, partly due to relatively low staking yields and a lack of sustained capital inflows. On-chain data and technical developments have failed to boost confidence, but Ethereum's DeFi ecosystem still maintains a strong moat. It is necessary to observe a rebound in funding rates and improvements in transaction fee revenue to determine the future market trend.
MarketWhisper11m ago
Bitcoin stabilizes above $70,000, IEA may release the largest-ever crude oil reserves, global risk asset sentiment improves
Bitcoin recently broke through $70,000 again, influenced by changes in the energy market. Its price once reached $71,612 before falling back to $70,036. The market sentiment is related to discussions with the International Energy Agency about releasing strategic oil reserves, and the decline in Brent crude oil prices is seen as a signal to reduce inflation pressure. The market is focused on the Federal Reserve policy meeting, with expectations that if oil prices remain below $90, it will create room for interest rate cuts.
GateNews15m ago
Bitcoin derivatives market turns bullish, traders bet on BTC surging past $80,000
Bitcoin market sentiment is improving, with more traders expecting the price to break above $80,000 in the coming months. The options market signals a bullish bias. Currently, Bitcoin is trading near $70,000, and analysts believe that if the bullish sentiment continues, a new directional move may emerge in the future.
GateNews18m ago
XRP Ledger daily trading volume soars to 2.7 million transactions, RWA enthusiasm heats up, but XRP price remains trapped in the $1.34—$1.44 range
XRP price has recently been volatile, staying between $1.34 and $1.44. However, XRP Ledger transaction activity has increased, with a daily trading volume of 2.7 million transactions, mainly driven by real-world asset tokenization projects. Analysts point out that the market is in a consolidation phase, with a focus on the stability of the $1.34-$1.35 support level. If this support holds, a breakout above $1.44 could be possible.
GateNews19m ago
Ethereum network activity reaches a new all-time high, but ETH price has fallen 30% over 6 months, ranking third in fee revenue.
Ethereum network activity reaches a new all-time high, with multiple indicators showing a significant increase in daily active addresses and smart contract calls. However, ETH price has fallen about 30% over the past six months, indicating a net capital outflow. Analysis suggests that capital flows have a greater impact on price. Despite Ethereum hosting a large amount of stablecoins, its value capture has not kept pace with the growth in network usage.
GateNews1h ago