Tokens in the AI sector within the cryptocurrency market have experienced a volatile week with a strong downward trend. According to data from CoinMarketCap, most of the leading tokens in this group have recorded significant declines over the past week.
Except for Story (IP) with a slight decrease of (-7.53%), all other tokens in the top 10 have fallen by double digits, with Artificial Superintelligence Alliance (FET) recording the smallest decline at -16.84%.
Virtuals Protocol (VIRTUAL) also was not an exception, dropping 15.71% over the week. However, from a technical analysis perspective, this correction opens up attractive opportunities for investors.
Is a buying opportunity approaching?
On the 1-day timeframe, after a strong rally to $1.19 in early January, the market experienced a deep correction. In a recent report, Coinphoton forecasted the possibility of the price returning to the $0.75 zone, and in fact, the $0.73-$0.76 price range still serves as an important support zone. This remains true at present, although short-term momentum and recent capital flows are showing a downward trend.
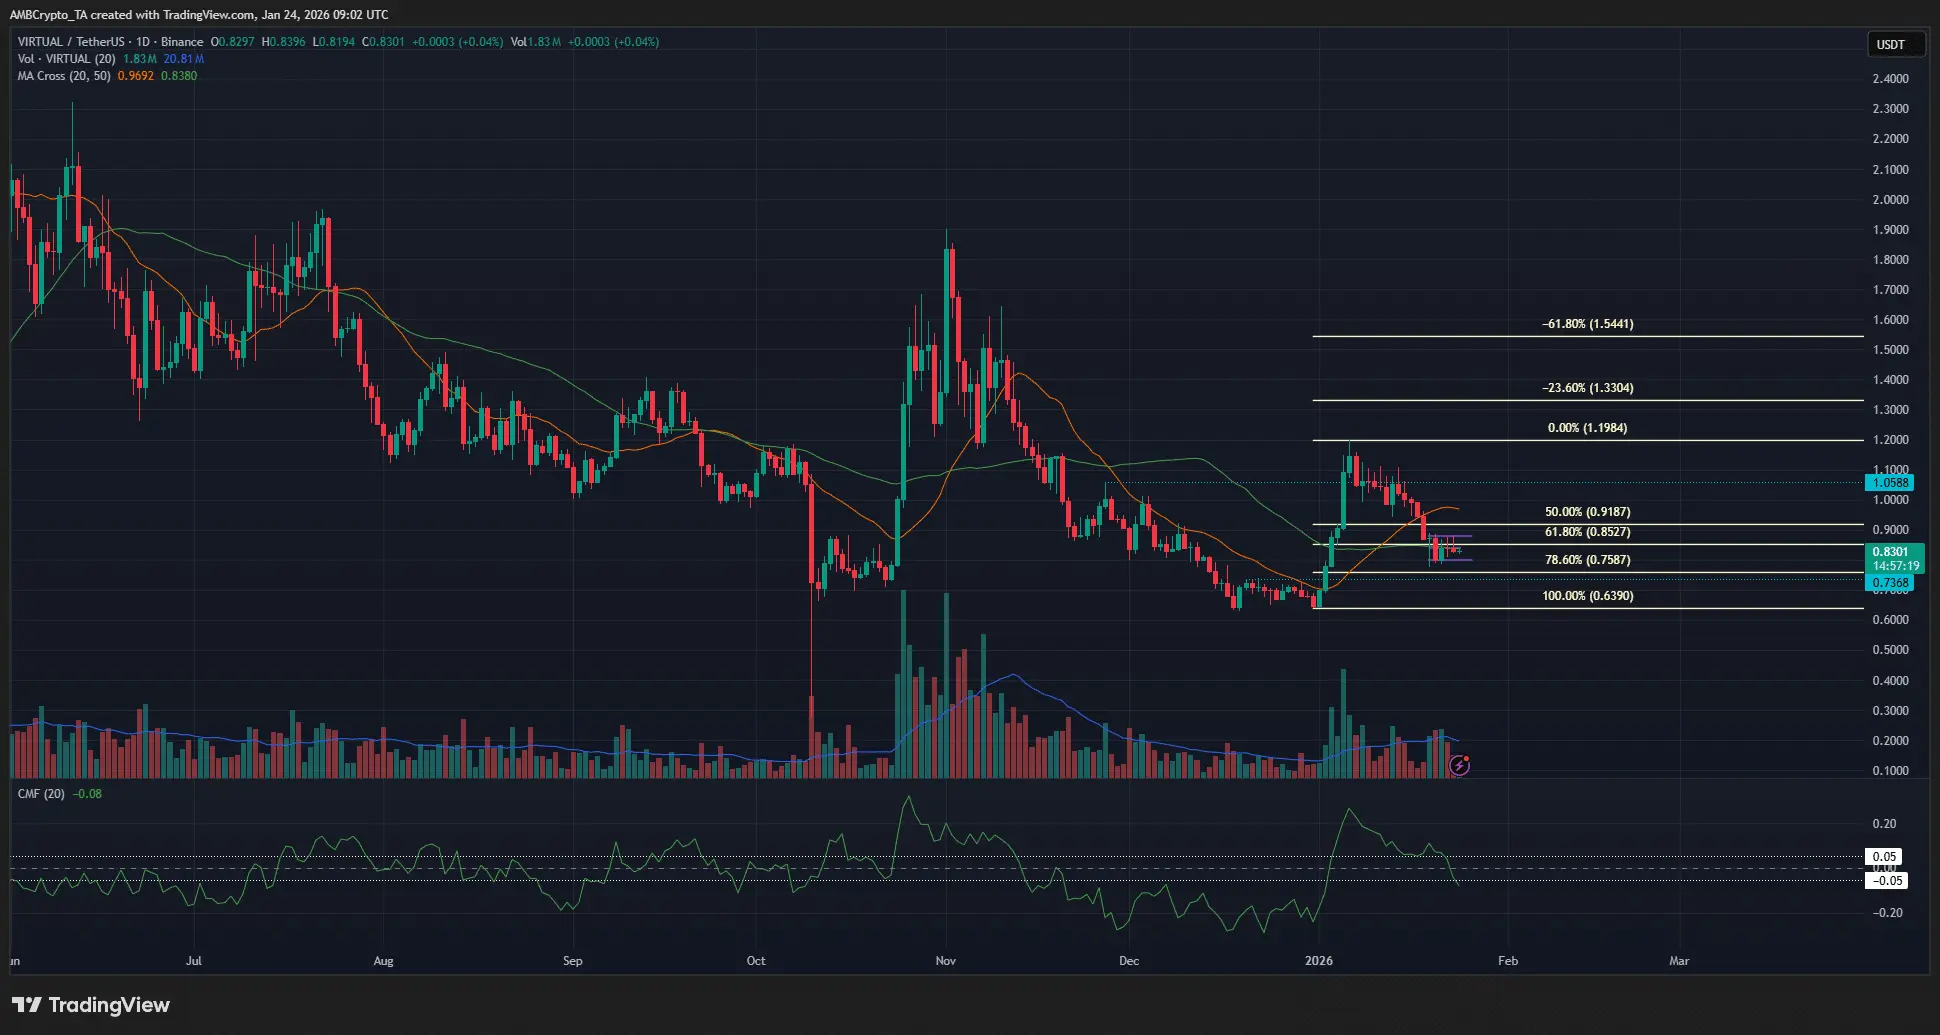 Source: TradingView Prices have broken through the 20 and 50-day moving averages, and the CMF indicator has fallen below -0.05, reflecting strong capital outflows from the market.
Capital flow on the exchange shakes buyer confidence
Besides technical indicators, the net flow index on the exchange is also leaning towards sellers. Over the past six months, capital transferred onto the (7DMA) exchange has mainly been positive, indicating investors continuously put VIRTUAL onto the exchange to sell. Although there have been short periods of capital withdrawal, such as in August, November, and a few recent days, the overall trend remains under selling pressure.
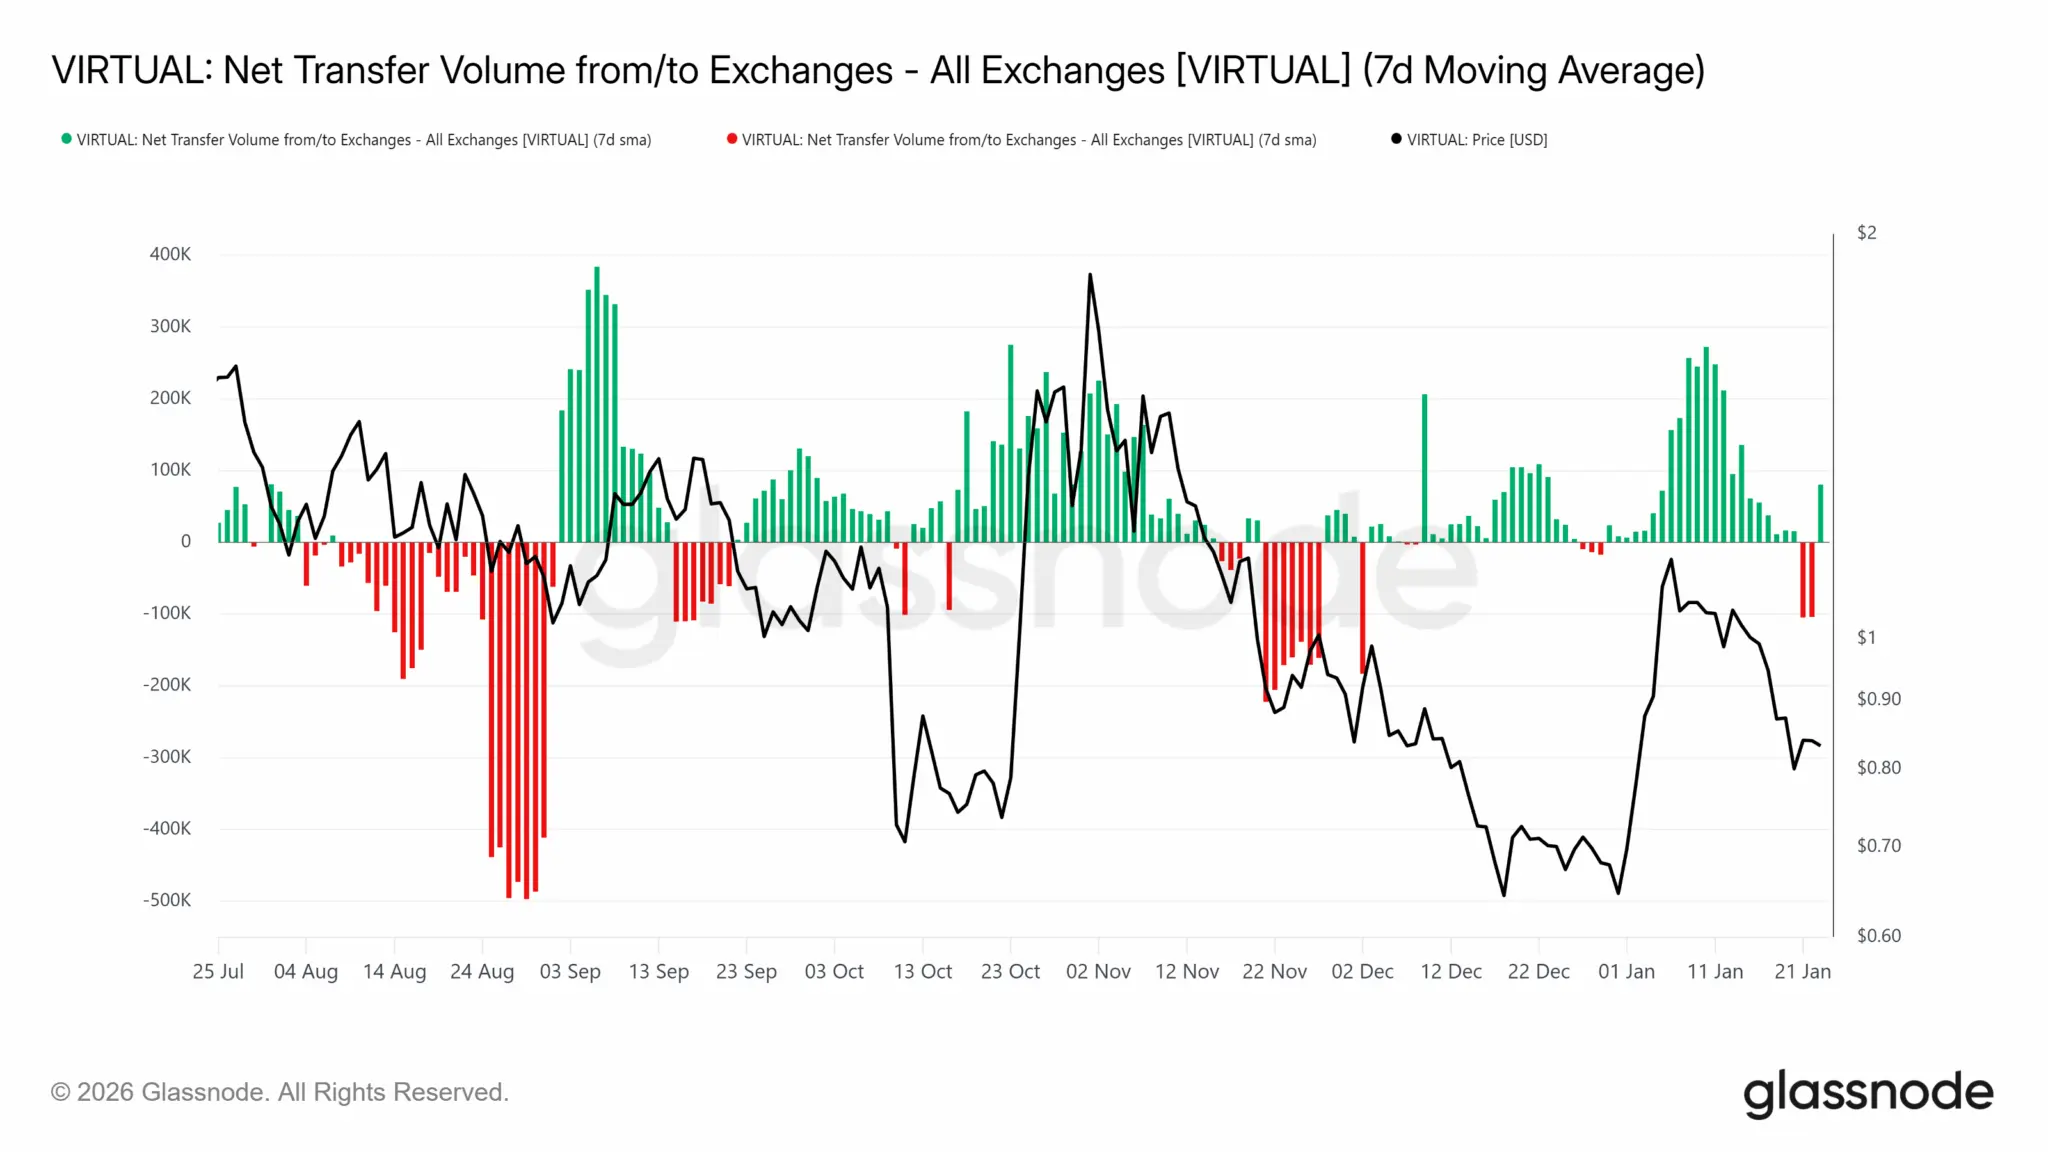 Source: Glassnode This reflects a lack of confidence in the market outlook among holders, as they continuously exit their positions.
It’s time for traders to consider buying
Although technical indicators and exchange capital flows both indicate risks, the price action shows a clearer directional signal. The breakout of VIRTUAL in early January, surpassing resistance levels at $0.73 and $1.05 from a prolonged downtrend, clearly demonstrated bullish intent.
As long as the support zone at the 78.6% retracement level at $0.758 is not broken by sellers, short-term traders can maintain a positive outlook. This deep correction is an opportunity to accumulate, with next target prices at $1.19 and $1.33.
Mr. Giáo
Disclaimer: The information on this page may come from third parties and does not represent the views or opinions of Gate. The content displayed on this page is for reference only and does not constitute any financial, investment, or legal advice. Gate does not guarantee the accuracy or completeness of the information and shall not be liable for any losses arising from the use of this information. Virtual asset investments carry high risks and are subject to significant price volatility. You may lose all of your invested principal. Please fully understand the relevant risks and make prudent decisions based on your own financial situation and risk tolerance. For details, please refer to
Disclaimer.
