
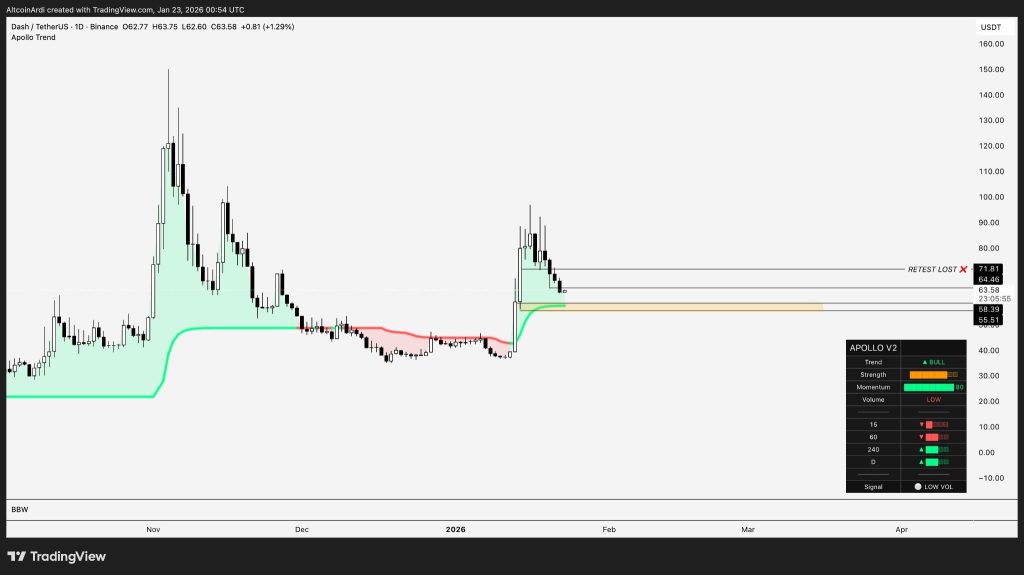
Prominent analyst Ardi summed it up well. Once DASH lost the $71 level, a pullback was almost guaranteed. And that is exactly what played out. The DASH price slid lower and is now sitting in the low-to-mid $60s, following a very textbook correction after a strong rally.
What makes this move interesting is how controlled it looks. After pushing hard to the upside and printing a sharp local top, DASH didn’t collapse. Instead, it stepped down slowly, forming what looks more like a reset than a breakdown.
The area around $71.81 now stands out as the key level that failed to hold. If buyers had managed to reclaim it, the move could have turned into a full continuation. Since that did not happen, the market shifted into a cooling phase instead.
- Why The DASH Pullback To This Level Matters
- The Real Test For DASH Sits In The Current Support Zone
- What’s Next for DASH?
Why The DASH Pullback To This Level Matters
One of the first stops on the way down was around $64. Ardi pointed out that the market was likely to sweep that wick, and the chart confirms it.
Source: X/@ArdiNSC
The DASH price dipped just below the $64.46 level, which is a classic behavior after fast upside moves. Price often revisits these zones to clear out late buyers and reset positioning.
This is usually where opinions split. Some traders see this area as a decent short-term dip opportunity, while others stay patient and wait for deeper levels. With volume currently low, both approaches make sense depending on the time frame.
The Real Test For DASH Sits In The Current Support Zone
The most important zone right now is clearly the liquidity pocket between $55 and $58. That range is marked on the chart for a reason. If the DASH price continues to slide, this is the area where buyers really need to step in.
This zone also defines whether the structure remains bullish. As long as DASH holds above it, the broader uptrend technically stays intact.
The Apollo Trend indicator still shows a bullish trend with strong momentum, but the low volume reading hints that the market is waiting for fresh participation before making its next big move.
Why Is Sentient (SENT) Price Pumping Right Now?_**
What’s Next for DASH?
If the DASH price fails to hold the $55–$58 area, the picture changes quickly. At that point, the move stops looking like a healthy correction and starts to resemble a deeper retracement.
That is where Ardi’s comment about ~$45 becoming a “magnet” comes into play, since that area acted as the base before the last breakout.
For now, DASH is simply catching its breath. It is not breaking structure yet. The next move is pretty clear: either it finds support in the $55–$58 zone and stabilizes, or it slips lower and opens the door for a move toward $45.
Disclaimer: The information on this page may come from third parties and does not represent the views or opinions of Gate. The content displayed on this page is for reference only and does not constitute any financial, investment, or legal advice. Gate does not guarantee the accuracy or completeness of the information and shall not be liable for any losses arising from the use of this information. Virtual asset investments carry high risks and are subject to significant price volatility. You may lose all of your invested principal. Please fully understand the relevant risks and make prudent decisions based on your own financial situation and risk tolerance. For details, please refer to
Disclaimer.
Related Articles
ETH 15-minute increase of 1.96%: On-chain large fund inflows and technical breakthroughs jointly amplify the rally
2026-03-09 19:15 to 19:30 (UTC), ETH achieved a short-term return of 1.96%, with the price range between 2010.14 and 2050.5 USDT, and an amplitude of 2.01%. Trading volume during this period significantly increased, market attention rapidly grew, and price fluctuations drew high investor interest.
The main driver of this movement was multiple large transfers of over 10,000 ETH on the blockchain, primarily flowing to a major exchange, indicating institutional or large investor accumulation, with positive capital inflows. At 19:15, ETH suddenly
GateNews5m ago
BTC 15-minute increase of 1.42%: On-chain capital inflow and technical breakout points resonate to trigger buying interest
From 19:15 to 19:30 on March 9, 2026 (UTC), the BTC price experienced a 15-minute return of +1.42%, with trading ranges between 68,377.3 and 69,365.3 USDT, and a volatility of 1.44%. This fluctuation far exceeds the regular intraday volatility levels, with market attention significantly heightened, and short-term buying surges intensifying the volatility.
The main driver of this movement was net inflow of on-chain funds, triggered by large transfers from major holder accounts, along with buy orders breaking through key technical resistance levels.
GateNews5m ago
Dogecoin Tests $0.090 Support After 3.4% Drop as Traders Watch Key Price Range
Dogecoin is currently trading at $0.09061 which is a drop of 3.4 percent, and the price is close to the important level of $0.09011 support.
The chart indicates a series of tests of the support zone of $0.089-$0.090, and the closest resistance is represented by $0.09353.
A hold of
CryptoNewsLand5m ago
Cardano Sees 1.7B ADA Traded as Price Tests Key Support
Key Insights
Cardano recorded more than 1.7 billion ADA in trading volume within 24 hours as market sentiment weakened and traders reacted cautiously.
On-chain data shows roughly 230 million ADA sold during the past week, which intensified selling pressure and pushed prices lower.
Cardano
CryptoFrontNews31m ago
TAO and NEAR Top AI Tokens to Watch, Target 57% Surge After Breaking Long-Term Descending Triang...
The cryptocurrency market is showing some strength in the second week of March 2026, with some assets such as Bittensor (TAO), NEAR Protocol (NEAR), and several others recovering from their deep corrections. Today, highly-followed crypto market analyst Michaël van de Poppe put forward a fresh
BlockChainReporter1h ago
XRP Slides to $1.42 After Losing $1.80–$2 Neckline as $1.39 Support Faces Immediate Test
XRP dropped to less than the $1.80-2 neckline and a key support area became an overhead and the overall trend was altered.
The current short-term trading corridor is between the support and resistance of the asset which is between $1.39 and $1.47 respectively.
A price above $1.39 will
CryptoNewsLand1h ago