
SUI price has spent the last few weeks drifting lower, frustrating anyone watching the chart closely. Each small bounce faded quickly, and sellers kept control of the bigger picture. That slow grind lower has now pushed SUI price into a zone that matters, and the chart is starting to hint that something different could be forming.
Over the last 17 days alone, SUI price has dropped by more than 30%. That kind of move usually leaves a clear emotional footprint on the chart, especially when price approaches levels where buyers previously stepped in with confidence. That moment is getting closer.
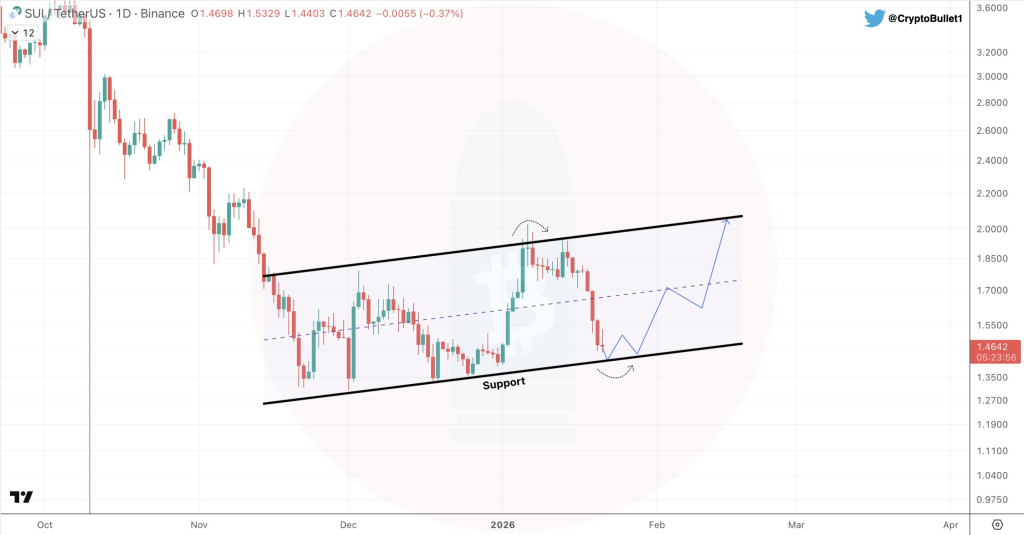
A tweet from a crypto analyst, Sui Insiders, has pointed out that SUI price is now back at daily support. That observation aligns with what the chart shows, as price sits near the lower channel boundary where buyers previously became active.
Current price action shows SUI price sliding back toward a zone where liquidity was absorbed in the past. That same area previously acted as a base before sharp upside moves. Price returning to such levels often forces the market to make a decision, either defending support again or breaking lower with momentum.
@SuiInsiders / X
The chart shows a potential bounce scenario toward $2.05, which aligns with the channel top. That target sits near the upper trendline, where price has been rejected multiple times before.
The attached chart helps visualize this setup clearly. SUI price is compressing near support, while the channel structure remains intact.
Price action shows long lower wicks forming near support, suggesting buyers are reacting even while the broader trend remains weak. That reaction alone does not confirm a reversal, yet it shows that sellers are no longer moving price freely.
SUI Indicators Still Point To Bearish Conditions Despite Support Holding
Technical indicators are still flashing caution across the board. Most momentum and trend indicators remain firmly in sell territory. That situation might look discouraging on the surface, yet indicators tend to lag price, especially during potential transition phases.
Price action remains the most real time signal, and it often shifts before indicators follow. That is why support reactions deserve attention even when indicators stay bearish.
Technical Indicator Snapshot For SUI
| Name |
| Value |
| Action |
| — |
| RSI(14) |
| 38.748 |
| Momentum remains weak, showing sellers still control strength levels |
| STOCH(9,6) |
| 20.492 |
| Oversold conditions persist without a confirmed reversal signal |
| MACD(12,26) |
| -0.023 |
| Trend momentum continues pointing lower with no bullish crossover |
| ADX(14) |
| 49.664 |
| Strong trend strength favors the existing bearish direction |
| ROC |
| -17.129 |
| Rate of change confirms negative momentum remains dominant |
These readings explain why caution still matters here. Indicators are not yet supporting a bullish shift, even though price is reacting at support.
Why Price Action Alone Is Not Enough To Call A Reversal For SUI
Price action offers valuable clues, yet relying on it alone carries risk. Strong reversals usually come with confirmation from multiple signals, including pattern development and improving indicator behavior. Waiting for signs such as higher lows, volume expansion, or indicator stabilization often reduces false signals.
Here’s the TAO Price If Bittensor Becomes the Backbone of Onchain AI_**
Support holds can fail, especially when broader market pressure remains heavy. A clean break below current support could open the door to deeper downside and shift the entire structure lower.
For now, SUI price sits at a crossroads. Support is being tested, indicators remain bearish, and the chart is asking an important question. The next reaction should reveal whether this level becomes a base or simply another pause before continuation.
Disclaimer: The information on this page may come from third parties and does not represent the views or opinions of Gate. The content displayed on this page is for reference only and does not constitute any financial, investment, or legal advice. Gate does not guarantee the accuracy or completeness of the information and shall not be liable for any losses arising from the use of this information. Virtual asset investments carry high risks and are subject to significant price volatility. You may lose all of your invested principal. Please fully understand the relevant risks and make prudent decisions based on your own financial situation and risk tolerance. For details, please refer to
Disclaimer.
Related Articles
BTC 15-minute rise of 0.60%: ETF capital inflows and technical breakout resonance drive short-term momentum
2026-03-13 12:45 to 2026-03-13 13:00 (UTC), BTC achieved a +0.60% return within 15 minutes, with a price range of 72341.6-72888.0 USDT and a volatility amplitude of 0.76%. Short-term price oscillations noticeably intensified. Due to abundant trading volume, market attention rose rapidly, reflecting a phase of strengthened buying power.
The primary drivers of this movement are continuous net inflows into ETFs and a technical breakout of key structures. In March 2026, BTC spot ETFs attracted capital inflows as high as 1.6 billion dollars in a single week.
GateNews19m ago
DeFi enters a "winter of yields": liquidity stagnation, leverage contraction, and the disappearance of arbitrage opportunities
The DeFi market entered an "interest rate winter" since September 2025, with deposit rates for major stablecoins declining sharply and supply-demand imbalances causing liquidity congestion. The rate decline reflects reduced capital demand and a lack of high-return opportunities. Stablecoin lending demand has dropped significantly, with market risk appetite shifting toward more stable investment channels. In response to this situation, the Sky protocol demonstrates competitiveness and adaptability by introducing real-world assets to enhance yields. The low interest rates during this phase can be viewed as an opportunity for DeFi market transformation.
区块客23m ago
"Seeking a Sword by Marking a Boat" - Style Coin Price Predictions Go Viral: The Practical Logic and Flaws of Mystical Prophecies
Author: Frank, PANews
Whenever the market enters a confusing phase of going nowhere, people try to use a "cutting the boat to seek the sword" method of historical retrospection to predict the next market movement. In such cases, people often see from these theories and charts that history always repeats itself, and seem to automatically overlay and verify future price movements with a certain period in the past.
This coincidence seems to have a magical effect and is often verified. Some bloggers claim this prediction method has an accuracy rate of 75%~80%.
Does this "cutting the boat to seek the sword" style price prediction that repeatedly goes viral on social media help the market identify stages, or is it just packaging noise as prophecy?
From "Tick Fractals" to "History Rhyming"
The peak operation regarding predictions of October 2025 market tops is an analyst named CryptoBullet, who created a method called "ti
区块客26m ago
Surviving Oscillating Markets: How Retail Investors Can Minimize Losses? Capital Flow Trends and Practical Guide
Author: MyToken
In the crypto market, sentiment often emerges more easily than logic. When "volatility" becomes the norm for the broader market and "anxiety" becomes the prevailing mindset among retail investors, a discussion on how to "lose less money" carries more practical significance than any macro narrative presentation.
Recently, the renowned data aggregation platform MyToken hosted an AMA event themed "In the Current Market, How Can Retail Investors Lose Less Money? Capital Flow and Practical Guide." The event invited independent trader BTC Bull Demon King and KTX Exchange CMO Christine, who provided puzzled investors with a practical "survival guide" from the perspectives of independent traders and trading platforms respectively.
Below is a highlight recap of this AMA.
---
Market Phase Consensus: Stop Fantasizing About a Bull Run, This is a "Consolidation Phase"
Market positioning is a relatively important issue, as it directly determines the next
PANews1h ago
NAV Price Surges 44.25%: Is a New Trend Emerging?
NAV coin recently surged by 44.25%, reaching $0.032715, amid increased trading activity and fluctuating market conditions. Analysts attribute this rally to rising on-chain activity and shifting sentiment toward altcoins, while traders monitor key price levels for future movements.
Coinfomania3h ago
Why TARA Just Skyrocketed 24.47% in 60 Minutes
TARA's price surged 24.47% to $0.000047 amid mixed signals in the crypto market and increased trading activity. Market conditions and macroeconomic factors are influencing investor sentiment, with traders closely monitoring key resistance and support levels.
Coinfomania3h ago