 The post Is LINK Price Gearing Up for a Breakout After Equities Go On-Chain? appeared first on Coinpedia Fintech News
The LINK price is back in focus in early 2026 as Chainlink expands its role beyond crypto-native markets. By bringing real-time U.S. stock and ETF pricing on-chain, the protocol is strengthening its position as core infrastructure for tokenized finance, while market sentiment and price structures hint at a key phase.
LINK Price Strengthens as Equities Go On-Chain
Chainlink recently introduced real-time U.S. stock and ETF price feeds to blockchain networks, a move that significantly expands DeFi’s addressable market. Until now, most decentralized applications relied on delayed or synthetic pricing when referencing traditional assets. With this upgrade, tokenized equities can now react to live market movements, allowing more accurate settlement, collateral management, and automated execution.
![]() As a result, the LINK crypto narrative has shifted toward infrastructure dominance. With nearly $80 trillion in global equities now compatible with on-chain systems, Chainlink is positioning itself at the center of tokenized finance, where reliable data is non-negotiable.
As a result, the LINK crypto narrative has shifted toward infrastructure dominance. With nearly $80 trillion in global equities now compatible with on-chain systems, Chainlink is positioning itself at the center of tokenized finance, where reliable data is non-negotiable.
Institutional Momentum and Social Signals Around LINK Price
Meanwhile, the announcement triggered a visible spike in social activity. Despite broader market weakness, LINK recorded a five-week high in social volume, indicating renewed attention
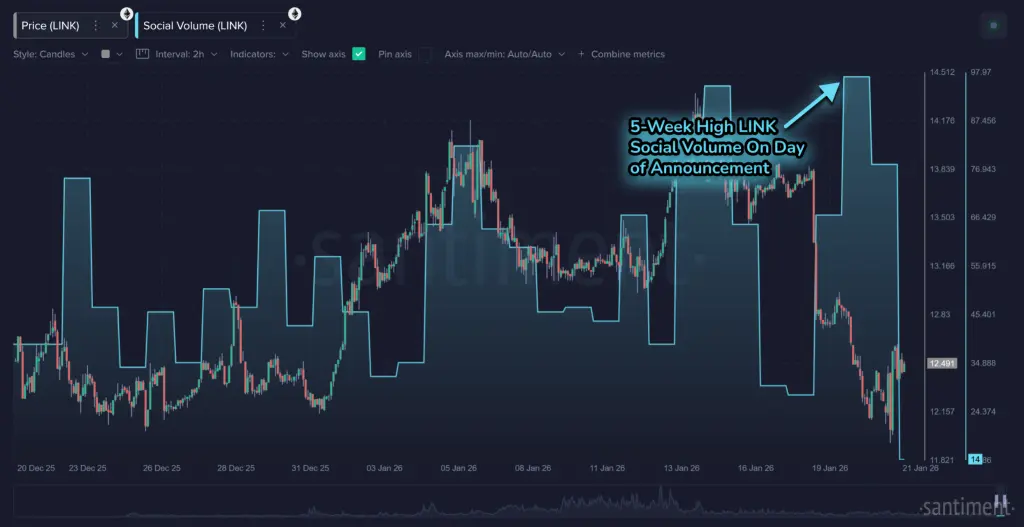 Historically, such spikes often coincide with key inflection points rather than sustained tops, particularly when paired with fearful sentiment.
Santiment data comparing bullish and bearish keywords shows elevated fear and selling trend
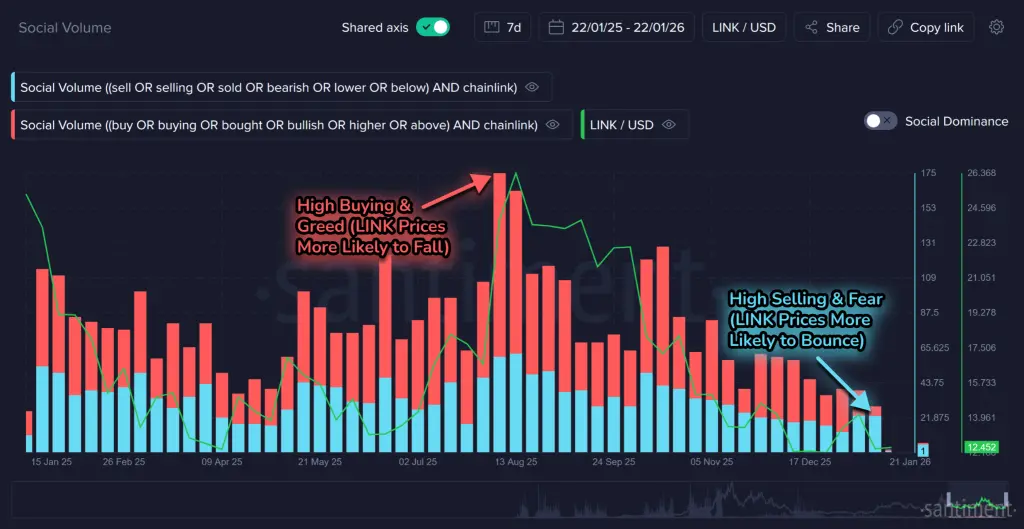 Interestingly, these conditions have often preceded price stabilization or rebounds, as excessive pessimism tends to reflect short-term exhaustion rather than structural weakness in the LINK price USD trend.
LINK Price Chart Reflects a Long-Term Technical Setup
From a market-structure perspective, the LINK price chart continues to trade within a long-term ascending trendline visible on higher timeframes. This pattern has already produced two strong rallies along the same rising trendline, reinforcing its technical relevance.
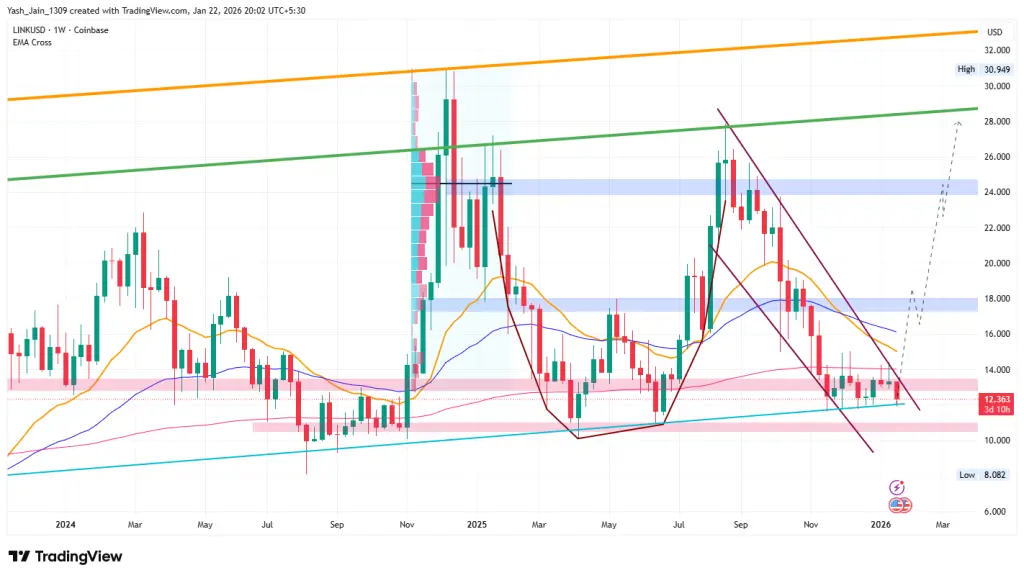 Currently, LINK/USD is consolidating near the lower boundary of this structure, a zone that has historically attracted demand. As long as this ascending trendline holds, the broader LINK price forecast remains constructive, with upside momentum gradually rebuilding after the recent correction.
Macro Relief Adds Breathing Room for LINK Price Action
In addition, short-term macro relief supported crypto sentiment after reports suggested that tariff-related tensions eased. This allowed market participants to refocus on protocol-level developments rather than macro shocks. In this context, Chainlink crypto’s expansion into real-world asset pricing stands out as a fundamental driver rather than a speculative headline.
Consequently, the LINK price prediction narrative increasingly ties valuation to infrastructure demand rather than cyclical hype, reinforcing its relevance in both DeFi and institutional blockchain adoption.
Disclaimer: The information on this page may come from third parties and does not represent the views or opinions of Gate. The content displayed on this page is for reference only and does not constitute any financial, investment, or legal advice. Gate does not guarantee the accuracy or completeness of the information and shall not be liable for any losses arising from the use of this information. Virtual asset investments carry high risks and are subject to significant price volatility. You may lose all of your invested principal. Please fully understand the relevant risks and make prudent decisions based on your own financial situation and risk tolerance. For details, please refer to
Disclaimer.
Related Articles
A certain whale received 245 BTC again eight hours ago, accumulating a total of 495.3 BTC purchased over the past two weeks.
Gate News reports that on March 10th, according to The Data Nerd monitoring, eight hours ago, a whale address bc1q8 received another 245 BTC (approximately $16.8 million). Data shows that over the past two weeks, this whale has accumulated a total of 495.3 BTC (approximately $33.4 million) through an institution, with an average purchase price of about $67,430.
GateNews2m ago
Bitcoin returns to $70,000: Geopolitical conflict concerns ease, ETF fund inflows continue to drive BTC rebound
On March 10th, Bitcoin broke through $70,000 during the East Asian trading session, completing a recovery after the weekend sell-off. As volatility in the energy markets eased, selling pressure on risk assets diminished. Market data shows that institutional capital inflows continue to support Bitcoin, investor sentiment is improving, and short-term upside potential is increasing.
GateNews8m ago
Yesterday, the US Bitcoin spot ETF experienced a net inflow of $57.73 million.
Gate News Report, March 10 — According to crypto analyst Trader T's monitoring, on March 9, the US Bitcoin spot ETF saw a net inflow of $57.73 million. Among them, FBTC (Fidelity) had a net inflow of $60.09 million; BITB (Bitwise) had a net outflow of $4.49 million; ARKB (Ark) had a net outflow of $274 million.
GateNews26m ago
Peter Brandt releases Bitcoin chart analysis showing a short-term bullish pattern
Gate News Announcement, March 10, renowned trader and chart analyst Peter Brandt released a Bitcoin chart analysis. Peter Brandt successfully predicted the 2018 Bitcoin crash. The chart shows the "Big Banana" chart displaying a large upward curved channel on the long-term weekly chart (2014-2027); the "Small Banana" chart shows a smaller similar curve currently forming near $69,000 on the daily chart. The arrows in the chart clearly point upward, indicating higher targets.
GateNews47m ago
BTC Price Fluctuation Analysis
# BTC Price Movement Deep Attribution Report for March 10, 2026, 02:30-02:45 (UTC)
## 1. Event Overview
Between 02:30 and 02:45 (UTC) on March 10, 2026, Bitcoin (BTC) experienced a significant price movement, with a return of +1.39%. The price fluctuations during this time window exceeded normal ranges, attracting market attention. This report will conduct a comprehensive attribution analysis based on on-chain data, market conditions, macroeconomic environment, trading behaviors, and other dimensions to uncover the true causes of the event and provide insights for investors.
GateNews54m ago