
Key Takeaways
-
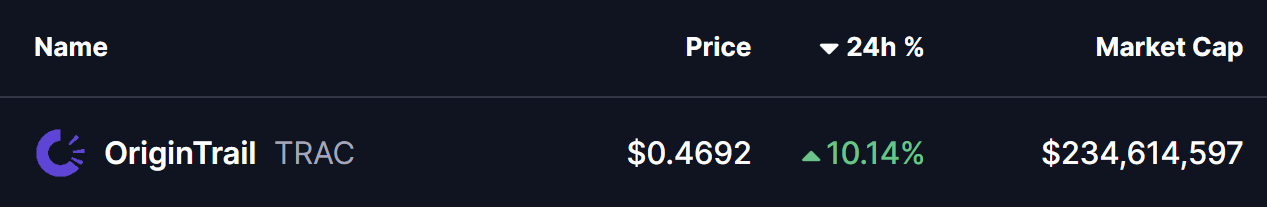
OriginTrail (TRAC) has surged around 12% in a single day, drawing renewed attention to the token.
-
TRAC has broken out from an ascending triangle near $0.46 on the daily chart, signaling growing bullish momentum.
-
Similar breakout structures in July and October 2025 previously led to strong rallies of 63% and 113%.
-
Holding the $0.44–$0.46 zone as support will be crucial to keep the bullish fractal setup intact.
-
If the pattern plays out, TRAC could attempt a move toward its long-term ascending resistance above $1.00.
OriginTrail, the decentralized knowledge graph protocol, is stepping back into the spotlight as its native token TRAC records a strong 12% daily surge. Beyond the price jump, the real signal is coming from the charts, where a familiar fractal breakout structure is starting to emerge on the daily timeframe, hinting that a larger upside move could be forming.
Source: Coinmarketcap
Fractal Breakout Hints at Potential Upside Move
On the daily chart, TRAC has confirmed a breakout from an ascending triangle pattern near the $0.46 level. This breakout is particularly important as price is now trading just above the 200-day moving average, a level that has historically acted as a major trend-defining zone for TRAC.
What makes this setup more compelling is its similarity to previous breakout phases. In late July 2025, a comparable structure resulted in a 63% upside move after price held above its breakout base. Later, in early October 2025, TRAC broke out from a right-angled descending broadening wedge pattern. That move was followed by a reclaim of the 200-day moving average and ultimately led to a powerful 113% rally.
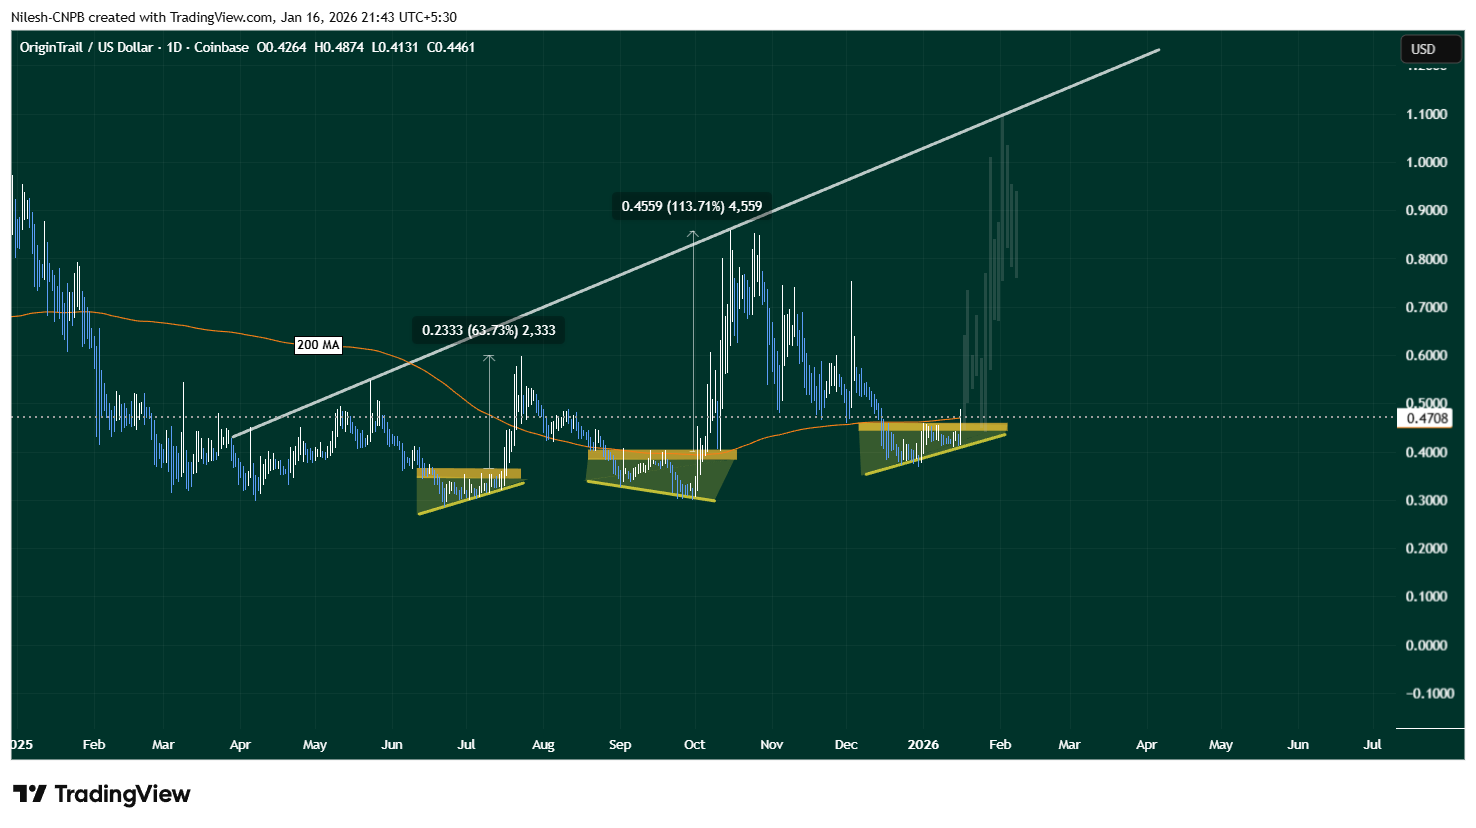
OriginTrail (TRAC) Daily Chart/Coinsprobe (Source: Tradingview)
The current setup shares key characteristics with those earlier moves. Price compression, a clean breakout, and interaction with the 200-day MA suggest that TRAC may once again be transitioning from consolidation into expansion.
What’s Next for TRAC?
If this fractal breakout plays out as expected, holding the $0.44–$0.46 zone as support will be crucial. A sustained hold above this range, along with continued strength above the 200-day moving average, could act as a launchpad for further upside.
In that scenario, TRAC may attempt a move toward its long-term ascending resistance trendline, which currently sits above the $1.00 level. A push toward that zone would align closely with the magnitude of prior fractal-driven rallies seen on the chart.
That said, fractal patterns are never guarantees. Broader market conditions, liquidity, and overall sentiment will continue to influence price action. A failure to hold the $0.44–$0.46 support zone or a rejection back below the 200-day moving average could invalidate the breakout and weaken the bullish fractal thesis.
Bottom Line
TRAC is showing early signs of another technically significant breakout, supported by historical fractal behavior and a reclaim of a key long-term moving average. If buyers can defend the current support zone, the chart suggests that OriginTrail may be positioning itself for a larger upside move in the weeks ahead.
Disclaimer: The views and analysis presented in this article are for informational purposes only and reflect the author’s perspective, not financial advice. Technical patterns and indicators discussed are subject to market volatility and may or may not yield the anticipated results. Investors are advised to exercise caution, conduct independent research, and make decisions aligned with their individual risk tolerance.
About Author: Nilesh Hembade is the Founder and Lead Author of Coinsprobe, with over 5 years of experience in the cryptocurrency and blockchain industry. Since launching Coinsprobe in 2023, he has been providing daily, research-driven insights through in-depth market analysis, on-chain data, and technical research.
Disclaimer: The information on this page may come from third parties and does not represent the views or opinions of Gate. The content displayed on this page is for reference only and does not constitute any financial, investment, or legal advice. Gate does not guarantee the accuracy or completeness of the information and shall not be liable for any losses arising from the use of this information. Virtual asset investments carry high risks and are subject to significant price volatility. You may lose all of your invested principal. Please fully understand the relevant risks and make prudent decisions based on your own financial situation and risk tolerance. For details, please refer to
Disclaimer.
Related Articles
Bitcoin Shows ‘Tentative Signs of Improvement’ as Iran Conflict Fears Wane
In brief
Bitcoin has climbed more than 4% to roughly $69,100 as risk assets steadied after oil retreated from a spike tied to Middle East tensions.
Futures open interest and aggressive buying in perpetual markets suggest traders are cautiously returning to leveraged positions.
U.S. spot B
Decrypt35m ago
Trump announces lifting of oil sanctions, Bitcoin surges to $69,500, Ethereum breaks through $2,053, and liquidations reach $342 million
Bitcoin and Ethereum rebounded after Trump announced a temporary suspension of some oil sanctions, with Bitcoin soaring to a high of $69,537 and Ethereum reaching $2,053 at one point. Oil prices fell sharply, easing inflation pressures, and market liquidity expectations improved, leading to gains in risk assets. However, analysts warn that the US-Iran conflict could still impact shipping through the Strait of Hormuz, and the decline in global oil prices remains uncertain.
動區BlockTempo40m ago
Why did Bitcoin rise today? Oil prices plummeted 30%, and Trump hinted that the Iran war is nearing an end.
President Trump announced that military actions against Iran have been completed ahead of schedule. This news changed market expectations of a prolonged conflict, leading to a sharp decline in oil prices and a subsequent rebound of approximately 2.4% in Bitcoin. The market recovery caused stocks related to cryptocurrencies to generally rise, indicating that the easing of geopolitical tensions has had a positive impact on risk assets.
MarketWhisper59m ago
ETH 15-minute increase of 0.96%: On-chain large-volume buying pressure intensifies amid macro and industry positive developments
From 00:15 to 00:30 on March 10, 2026 (UTC), the price of ETH increased by 0.96% within 15 minutes, with a price range of 1994.66 to 2015.21 USDT, and a volatility of 1.03%. During the same period, market trading activity was active, liquidity flows significantly increased, social attention rose, and volatility intensified.
The main driver of this ETH price fluctuation was the occurrence of multiple large buy orders on-chain. Institutional and large-scale investors concentrated their funds into mainstream trading platforms, with nearly 48,000 ETH in trading volume supporting the rapid price movement.
GateNews1h ago
Cryptocurrency Fear and Greed Index rises to 13 today, and the market remains in a state of extreme panic.
Gate News Report, March 10th, according to Alternative.me data, the cryptocurrency fear and greed index today is 13, up from yesterday's 8, but market sentiment remains in a state of "extreme fear."
GateNews1h ago
Trump says the war will end soon! Oil prices plummet, and the US stock market makes a surprising rebound
U.S. President Trump hinted that the Iran war will end quickly, leading to a rebound in the US stock market and a sharp drop in oil prices. Bitcoin retreated to 68K, and Ethereum is around 2000. MicroStrategy and BitMine continue to buy cryptocurrencies, and the Fear and Greed Index has risen. The market faces uncertainty, with the risk of a stock market crash rising to 35%.
ChainNewsAbmedia2h ago