
Key Takeaways
-
Litecoin (LTC) has dropped nearly 10% over the past week, underperforming Bitcoin and Ethereum.
-
Despite the price dip, whales are heavily accumulating LTC in both spot and futures markets.
-
Large holders have been net buyers since prices fell near the $75 level, signaling long-term confidence.
-
On the daily chart, LTC is forming a right-angled descending broadening wedge pattern.
-
The $69.46 trendline support has held firm, triggering a bounce back above $73.
-
A breakout above the $81.16–$87.54 resistance zone could open the door for a move toward $100.
-
A breakdown below $69.46 would invalidate the bullish setup and weaken the outlook.
Litecoin (LTC) has shown contrasting price action over the past week compared to the broader crypto market. While Bitcoin (BTC) and Ethereum (ETH) are both up more than 5% during the same period, LTC has declined by nearly 10% in the last seven days. However, beneath this short-term weakness, on-chain and derivatives data suggest a very different story may be unfolding.
The recent dip appears to have attracted aggressive buying from large players, while the chart structure hints that Litecoin could be approaching a critical inflection point.
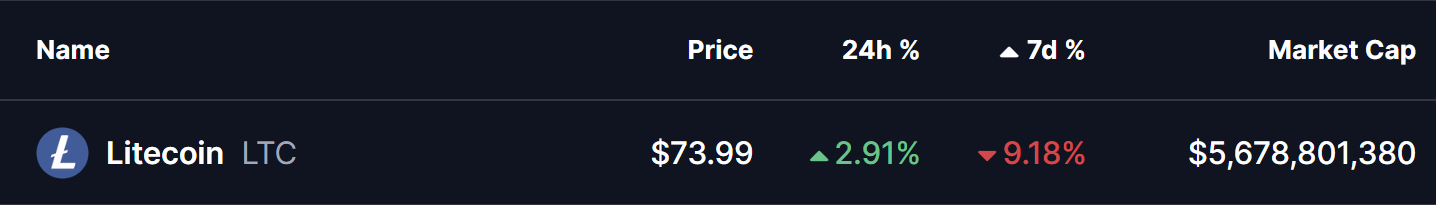
Source: Coinmarketcap
Litecoin (LTC) Sees Major Whale Accumulation
According to the latest insights from CryptoQuant, Litecoin is currently witnessing strong accumulation from whales. Data shows that large holders have been net buyers of LTC in the spot market since price dropped toward the $75 region.
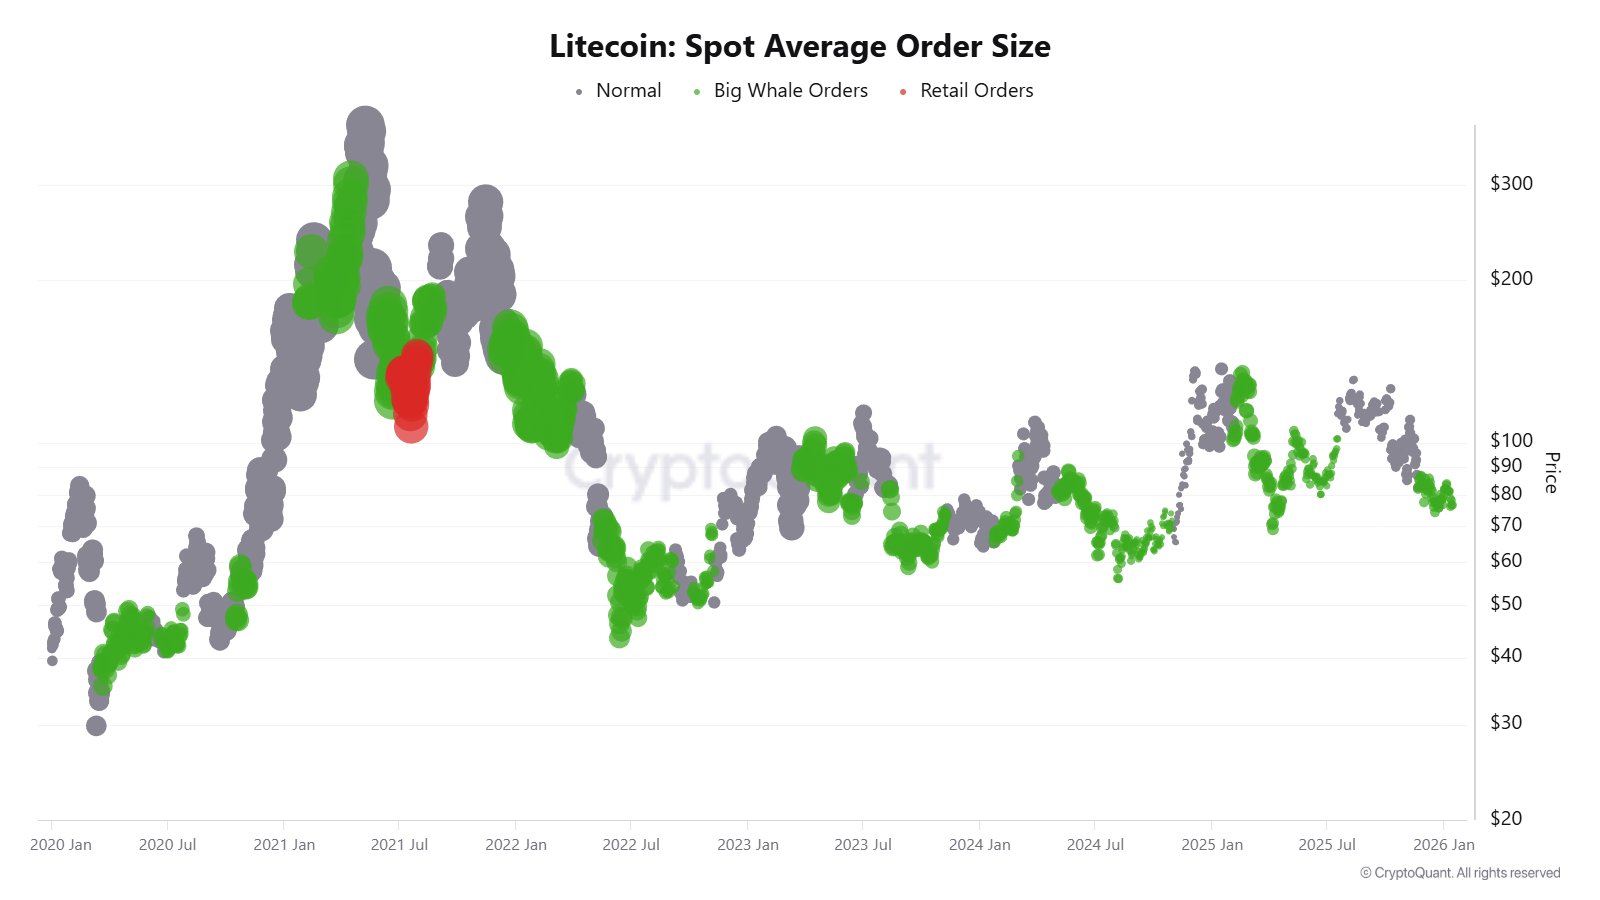
Litecoin Spot Buying By Whales/Source: @CW8900 (X)
At the same time, whale activity in the futures market also points to growing bullish conviction. Large traders have been steadily building long positions, suggesting expectations of higher prices ahead rather than hedging or short exposure. Historically, periods where whales accumulate during price weakness have often preceded notable trend reversals for Litecoin.
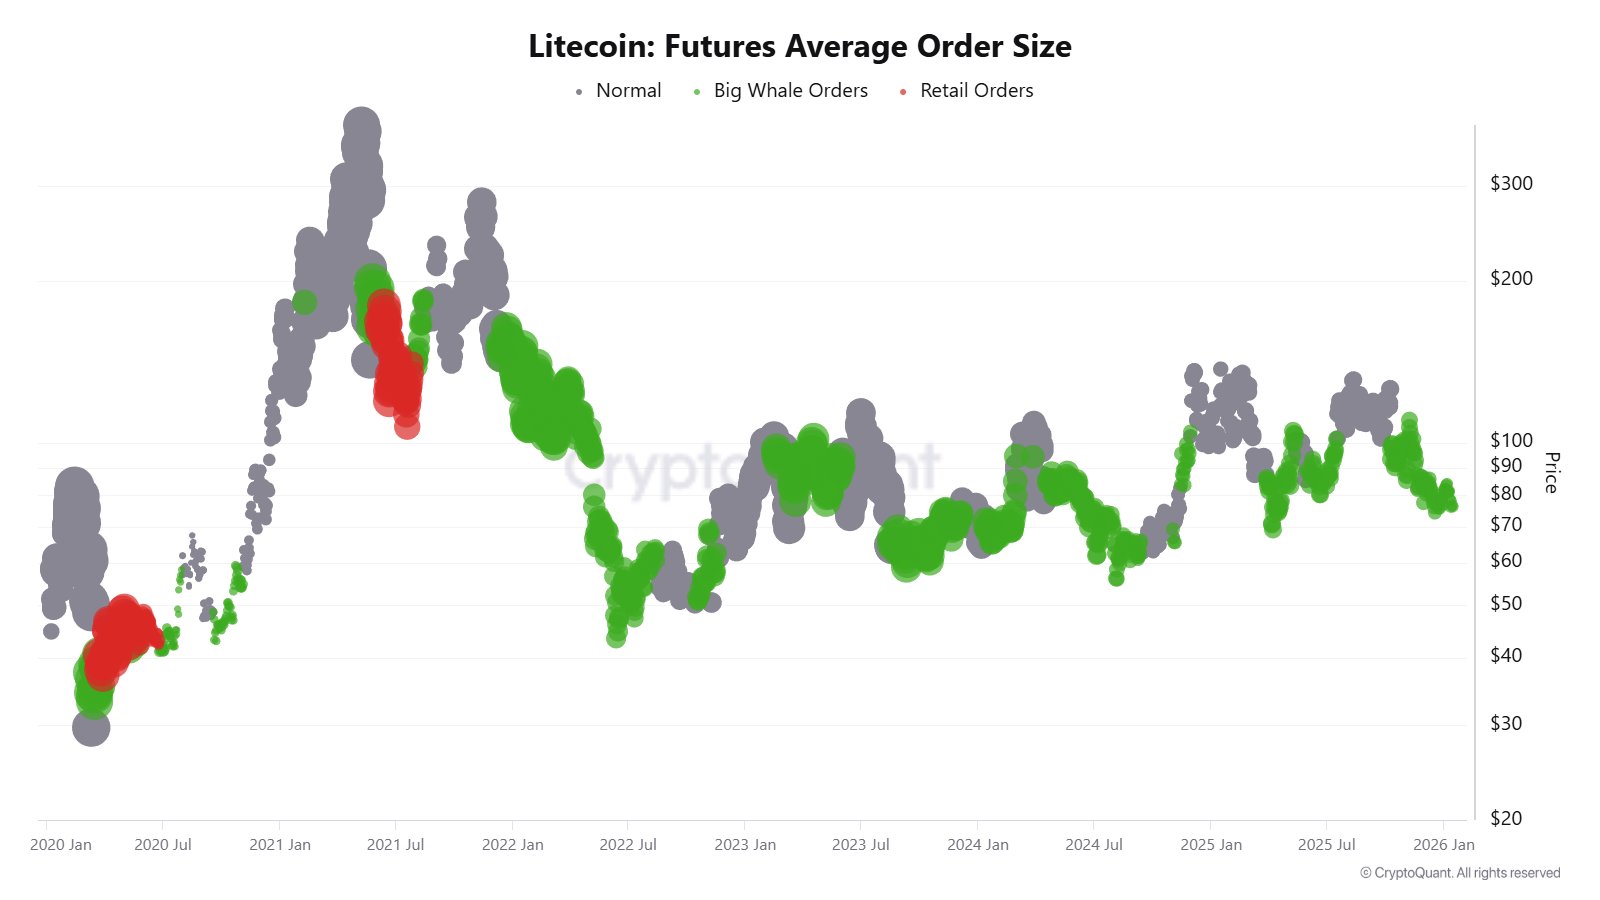
LTC Whale Buying in Futures/Source: @CW8900 (X)
This alignment between spot accumulation and futures positioning strengthens the bullish undertone despite recent price softness.
Is an Upside Breakout Brewing?
From a technical perspective, Litecoin’s daily chart is forming a potential right-angled descending broadening wedge pattern. This structure is defined by a flat to slightly rising resistance zone and a downward-sloping support trendline, often associated with volatility expansion and eventual directional moves.
The $81.16–$87.54 zone has acted as a strong neckline resistance, repeatedly capping upside attempts. On the downside, LTC recently revisited the lower boundary of the wedge near $69.46. Buyers stepped in decisively at this level, defending the trendline and triggering a rebound toward the $73–$74 area.

Litecoin (LTC) Daily Chart/Coinsprobe (Source: Tradingview)
This bounce from structural support, combined with rising whale accumulation, suggests that selling pressure may be weakening while larger players quietly position for a breakout attempt.
What’s Next for LTC?
If Litecoin continues to hold above the $69.46 support trendline, the probability of a renewed push toward the neckline resistance increases. A re-test of the $81.16–$87.54 zone appears likely if momentum builds.
A successful breakout and sustained hold above this resistance range could confirm the bullish wedge resolution and potentially open the door for a move toward the psychological $100 level and beyond.
On the flip side, a decisive breakdown below the $69.46 support would invalidate the current pattern and weaken the bullish outlook, potentially exposing LTC to deeper downside before a meaningful recovery attempt.
Bottom Line
While Litecoin has underperformed in the short term, the combination of heavy whale accumulation and a well-defined bullish chart structure suggests that the current dip may be more of an accumulation phase than a breakdown. If support continues to hold and buyers reclaim key resistance levels, LTC could be setting the stage for a sharp upside breakout in the weeks ahead.
Disclaimer: The views and analysis presented in this article are for informational purposes only and reflect the author’s perspective, not financial advice. Technical patterns and indicators discussed are subject to market volatility and may or may not yield the anticipated results. Investors are advised to exercise caution, conduct independent research, and make decisions aligned with their individual risk tolerance.
About Author: Nilesh Hembade is the Founder and Lead Author of Coinsprobe, with over 5 years of experience in the cryptocurrency and blockchain industry. Since launching Coinsprobe in 2023, he has been providing daily, research-driven insights through in-depth market analysis, on-chain data, and technical research.
Disclaimer: The information on this page may come from third parties and does not represent the views or opinions of Gate. The content displayed on this page is for reference only and does not constitute any financial, investment, or legal advice. Gate does not guarantee the accuracy or completeness of the information and shall not be liable for any losses arising from the use of this information. Virtual asset investments carry high risks and are subject to significant price volatility. You may lose all of your invested principal. Please fully understand the relevant risks and make prudent decisions based on your own financial situation and risk tolerance. For details, please refer to
Disclaimer.
Related Articles
19.81% Surge for DUSK: What It Means for Traders
DUSK's price surged 19.81% to $0.09667 amid increased market activity and a broader altcoin shift. Analysts highlight its rising relevance and key resistance at $0.10, suggesting significant future trading interest.
Coinfomania9m ago
Bitcoin Briefly Falls Below $70,000 Mark During Asian Session as Fed Hawkishness and Macro Uncertainty Weigh on Market Volatility
Bitcoin dipped below $70,000 on March 19th, touching a low of approximately $69,537, reflecting the market's reassessment of the Federal Reserve's interest rate decision and inflation outlook. Although it later rebounded to around $70,180, the $70,000 level remains a key support in the near term. With weakening market sentiment, coupled with energy prices and macro risks, capital is turning more conservative, and Bitcoin may consolidate around the $70,000 level going forward.
区块客1h ago
XRP Enjoying 'Strong Retail Demand,' Report Says - U.Today
The essay explores the contrasting dynamics between retail and institutional demand in the cryptocurrency market. It highlights XRP's strong retail base and growing adoption, while institutional interest remains cautious, especially compared to assets like Bitcoin and Ethereum, amid recent ETF flows.
UToday1h ago
Fractal model predicts Bitcoin will hit bottom in October 2026
Bitcoin shows positive recovery signals, improving market sentiment after a long phase of volatility. However, experts believe the current uptrend is short-term, with deeper correction risks ahead. According to Crypto Rover's fractal model, Bitcoin's price follows a four-year cycle influenced by halving events. The current cycle likely peaked in late 2025, with further declines expected before a potential bottom around 2026. Short-term price fluctuations can mislead investors, emphasizing the importance of understanding these cycles for long-term trends.
TapChiBitcoin1h ago
Bittensor Holds Strength but Faces Resistance Near $285 Level
Key Insights:
Bittensor maintains strong short-term momentum above key averages, while ETF developments and high staking levels continue shaping liquidity and investor demand dynamics.
Overbought technical indicators signal stretched conditions, even as bullish momentum persists,
CryptoFrontNews2h ago
Dogecoin Slides Despite Elon Musk Reviving DogeFather Persona
Key Insights
Elon Musk’s DogeFather post sparked attention, yet Dogecoin’s price declined, showing limited market reaction despite strong social media engagement and renewed community discussion.
Dogecoin traded near $0.093 after a failed recovery attempt, with steady volume and moderate
CryptoFrontNews2h ago
