Key Takeaways
-
Avalanche (AVAX) has dropped over 16% in the past week, reflecting broader market weakness.
-
The 4H chart shows a Bullish Shark harmonic pattern, often associated with trend reversals.
-
Price is currently hovering near the $11.88 support, a critical zone for pattern validation.
-
If support holds, AVAX could rebound toward $13.39, with a higher upside target near $14.94.
-
A breakdown below the current support would invalidate the bullish setup and extend downside risk.
The cryptocurrency market remains under notable selling pressure as the total crypto market capitalization slipped 1.79% over the past 24 hours. This broader pullback triggered heightened volatility across digital assets, leading to more than $807 million in liquidations, with long positions bearing the brunt of the losses.
This wave of downside pressure has spilled into major altcoins, including Avalanche (AVAX). The token is trading slightly in the red and has dropped over 16% in the past seven days. However, beyond the red candles, AVAX’s chart is beginning to reveal a technical structure that suggests downside momentum may be weakening — and a rebound could be forming.
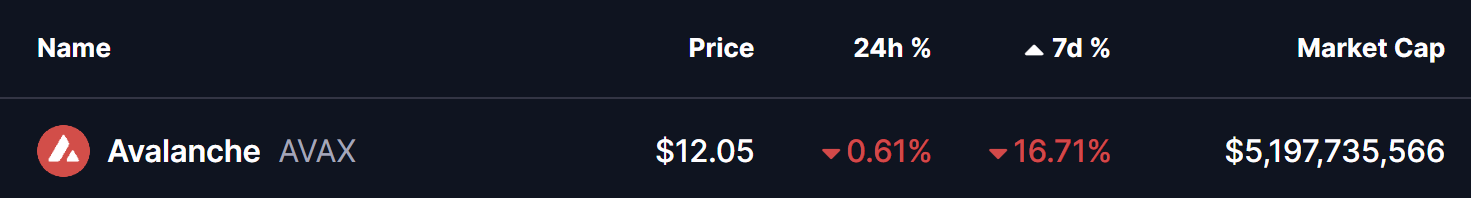
Source: Coinmarketcap
Harmonic Pattern Hints at Potential Upside
On the 4-hour timeframe, AVAX appears to be completing a Bullish Shark harmonic pattern, a formation that often emerges near market lows when selling pressure becomes exhausted. This pattern typically signals a potential trend reversal once its final leg forms within a defined demand zone.
The structure began with the initial O–X impulse around the $12.22 area, followed by a sharp rally that peaked near $14.83 at point X. Price then retraced aggressively toward point A before making another push higher to form point B near $14.94. That move, however, failed to sustain, triggering the current corrective leg.
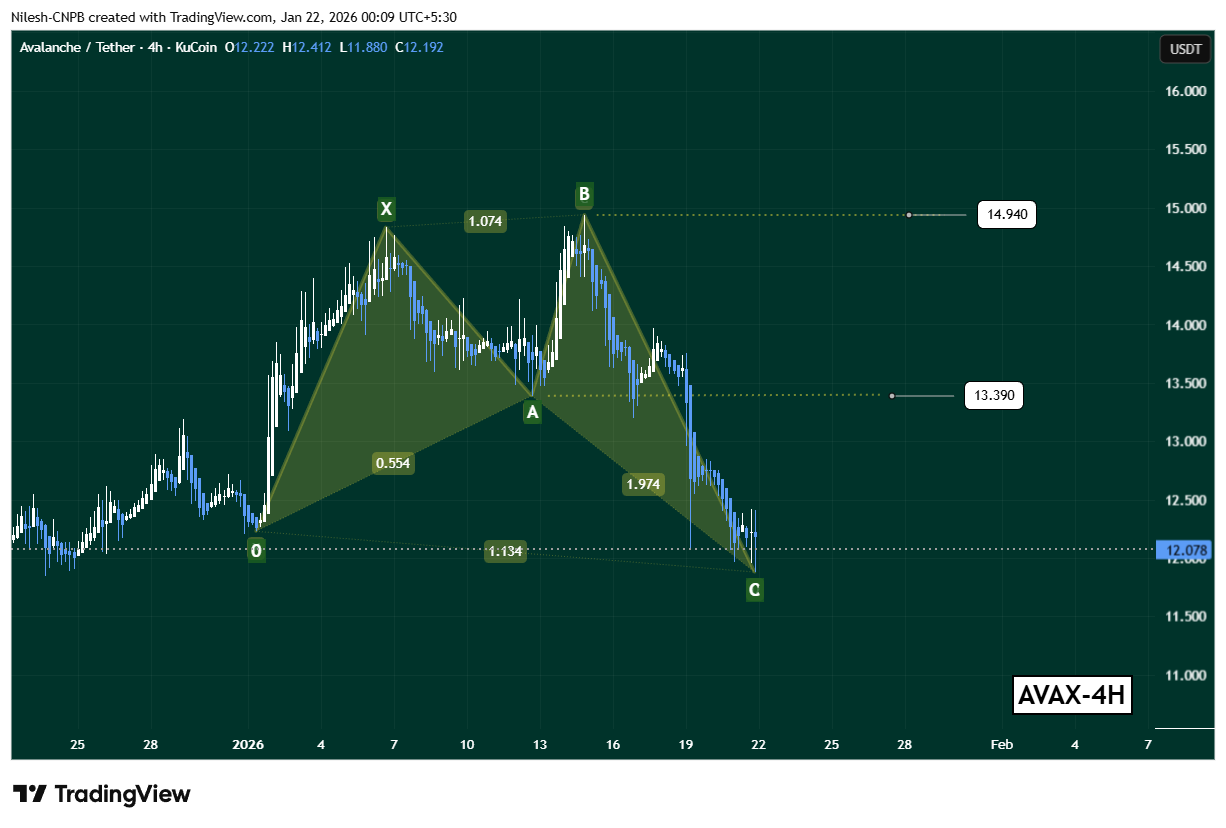
Avalanche (AVAX) 4H Chart/Coinsprobe (Source: Tradingview)
AVAX has since slid steadily lower, with price now hovering near $11.88, a level that could represent the C-point completion of the Shark pattern. This zone is technically important, as it’s where buyers often step in if the pattern is to play out bullishly.
What’s Next for AVAX?
If this harmonic structure continues to unfold as expected, AVAX could be positioning for a rebound from current levels. The first key upside level to watch sits around $13.39, which aligns closely with the prior A-point of the formation and serves as a near-term recovery target.
A stronger bullish follow-through could eventually bring the $14.94 region back into focus — the B-leg high and a significant resistance zone where sellers previously stepped in.
That said, the bullish outlook remains conditional. A sustained breakdown below the $11.88 support zone would invalidate the Shark pattern and shift momentum back in favor of the bears, opening the door for further downside continuation.
Bottom Line
AVAX may still be under pressure, but the emerging Bullish Shark harmonic pattern suggests selling momentum could be nearing exhaustion. As long as price holds above the current support zone, the setup favors a short-term rebound toward $13.39 and potentially $14.94. However, confirmation will depend on buyer response at current levels — making the next few sessions critical for Avalanche’s near-term direction.
Disclaimer: The views and analysis presented in this article are for informational purposes only and reflect the author’s perspective, not financial advice. Technical patterns and indicators discussed are subject to market volatility and may or may not yield the anticipated results. Investors are advised to exercise caution, conduct independent research, and make decisions aligned with their individual risk tolerance.
About Author: Nilesh Hembade is the Founder and Lead Author of Coinsprobe, with over 5 years of experience in the cryptocurrency and blockchain industry. Since launching Coinsprobe in 2023, he has been providing daily, research-driven insights through in-depth market analysis, on-chain data, and technical research.
Disclaimer: The information on this page may come from third parties and does not represent the views or opinions of Gate. The content displayed on this page is for reference only and does not constitute any financial, investment, or legal advice. Gate does not guarantee the accuracy or completeness of the information and shall not be liable for any losses arising from the use of this information. Virtual asset investments carry high risks and are subject to significant price volatility. You may lose all of your invested principal. Please fully understand the relevant risks and make prudent decisions based on your own financial situation and risk tolerance. For details, please refer to
Disclaimer.
Related Articles
Cardano áp sát mốc 0,28 USD khi lực mua nhỏ lẻ tăng mạnh – Đà bứt phá đã cận kề?
The current price of Cardano (ADA) is around $0.270, having risen from a support level of $0.254-$0.260. It underwent a dip to $0.2194 before buyers returned, leading to a structure indicating accumulation. The price tests resistance at $0.287, while whale activity raises market uncertainty. Despite a reduction in ADA holdings among large wallets, the supply remains concentrated in their hands, suggesting strategic liquidity reallocation rather than widespread selling. Meanwhile, retail investors continue accumulating ADA.
TapChiBitcoin2h ago
Bitcoin MVRV Z-Score Drops Below 1 Again
The MVRV Z-Score is a key on-chain indicator for assessing Bitcoin's value by comparing market and realized capitalizations. Historical data shows that when the score drops below 1, it often signals significant market recovery. However, changing market dynamics and institutional influences may alter future patterns.
Coinfomania2h ago
「刻舟求劍」式幣價預測走紅,玄學預言的實戰邏輯與缺陷
作者:Frank,PANews
每當市場進入不上不下的迷惘階段,就會有人試圖用「刻舟求劍」式的歷史回溯方法去預測下一段走勢。在這種情況下,人們往往能從這些理論和圖表中看到歷史總是在重演,並似乎自動將未來一段時間的行情走勢與過去的某一段進行重疊驗證。
這種重合似乎有著神奇的效果,也常常被驗證。有部落客自稱這種預測的準確率能到達 75%~80% 。
這種在社群媒體上屢屢爆紅的「刻舟求劍」式價格預測,究竟是在幫助市場識別階段,還是在把噪音包裝成預言?
從「滴答分形」到「歷史押韻」
關於 2025 年 10 月市場頂點預測的巔峰操作是名為 CryptoBullet 的分析師,他所創建的一種名為「ti
区块客3h ago
Dogecoin (DOGE) Prints Abnormal $0 as Short Sellers Disappear - U.Today
Dogecoin's recent rally saw $0 in short liquidations, indicating traders were betting long. Despite a 4.61% decline due to market pullback, volume remained high. The potential for DOGE to reach $0.10 depends on Bitcoin's recovery.
UToday3h ago
Bitcoin Holds Steady Amid Middle East Escalation
Bitcoin demonstrates resilience at $70K amid geopolitical tensions in the Middle East, with declining exchange-held Bitcoin indicating investor confidence. Market reactions reflect a growing stability, despite volatility from conflict risks.
CryptoFrontNews4h ago
Liệu Dogecoin có chững lại trong một phạm vi giá kéo dài nhiều tuần bất chấp đợt tăng giá 15%?
Dogecoin (DOGE) has successfully defended the crucial support level of $0.088 despite recent selling pressure, aided by Bitcoin's recovery. While DOGE saw a significant 15% increase recently, long-term trends remain bearish. Rising social media interactions and potential short liquidations could drive short-term growth, but long-term recovery may require surpassing $0.127.
TapChiBitcoin5h ago