In recent trading sessions, MemeCore (M) attracted attention as the price surged by 8% in a single day after breaking out from a critical technical support convergence zone around the $1.5 mark.
This move occurred after the price successfully reversed from the convergence area between the upward trendline and the support of the key Exponential Moving Average (EMA). This strong retest marked a clear shift in short-term momentum, especially after a week of consolidation within a narrow range.
In recent sessions, M has mainly traded within a limited price zone, continuously testing structural support levels. In fact, since late December, M’s price has maintained a consolidation pattern known as a “pennant” (pennant), reflecting market hesitation.
However, at present, the consolidation process seems to be gradually concluding on the daily chart. The latest rebound has helped buyers regain control, bringing the price closer to the next important technical zone – most likely the resistance at $1.90.
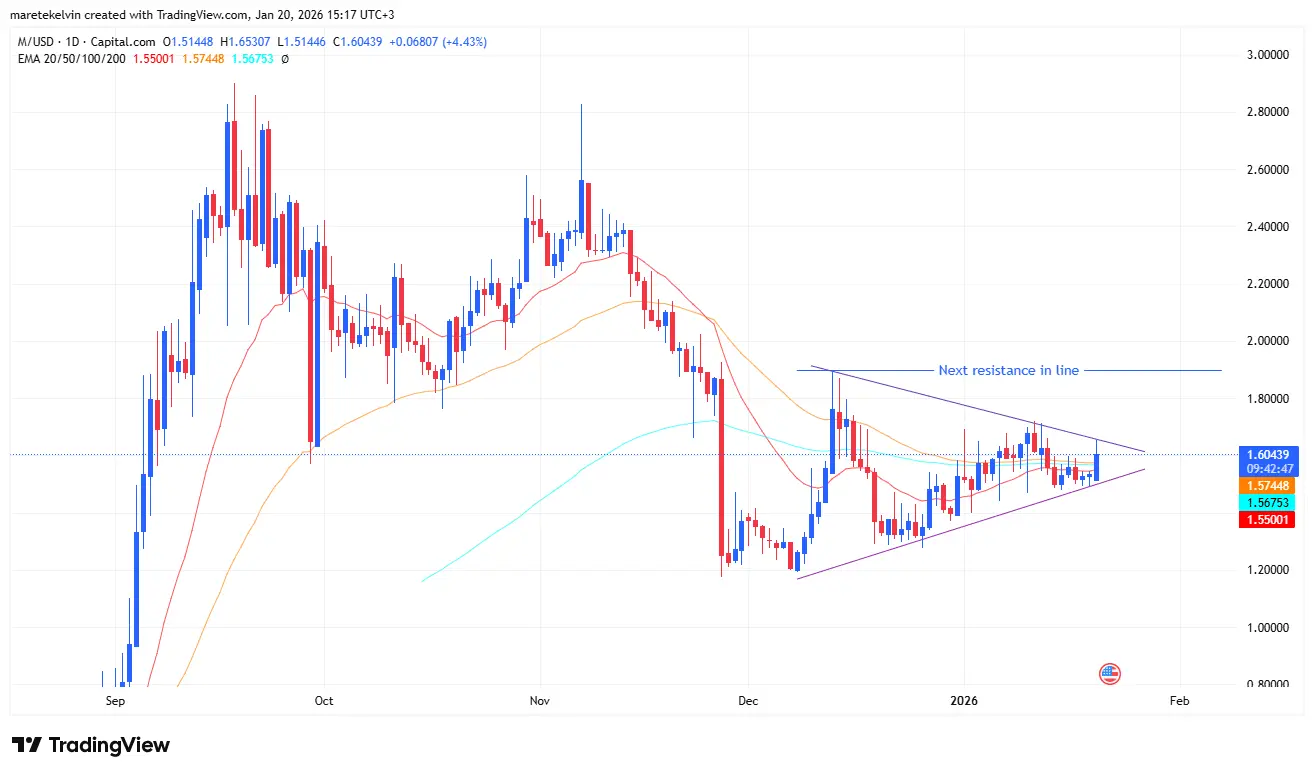 Source: TradingView## $1.90: The Next Critical Challenge
After breaking through the support convergence zone, the $1.90 resistance has become the market’s next focal point. This area could see selling pressure return, posing a challenge to the current upward momentum.
The continuous approach of M to this zone has attracted particular attention from traders, as the price reaction here could shape the short-term trend.
While the bullish momentum remains intact, investors are closely monitoring how M reacts at this resistance zone to make appropriate decisions.
Futures trading volume surges, reflecting strong interest
According to data from Coinglass, M’s daily futures trading volume increased by $2.4 million, reaching $36.63 million. This indicates growing participation from traders and reflects short-term interest in price volatility.
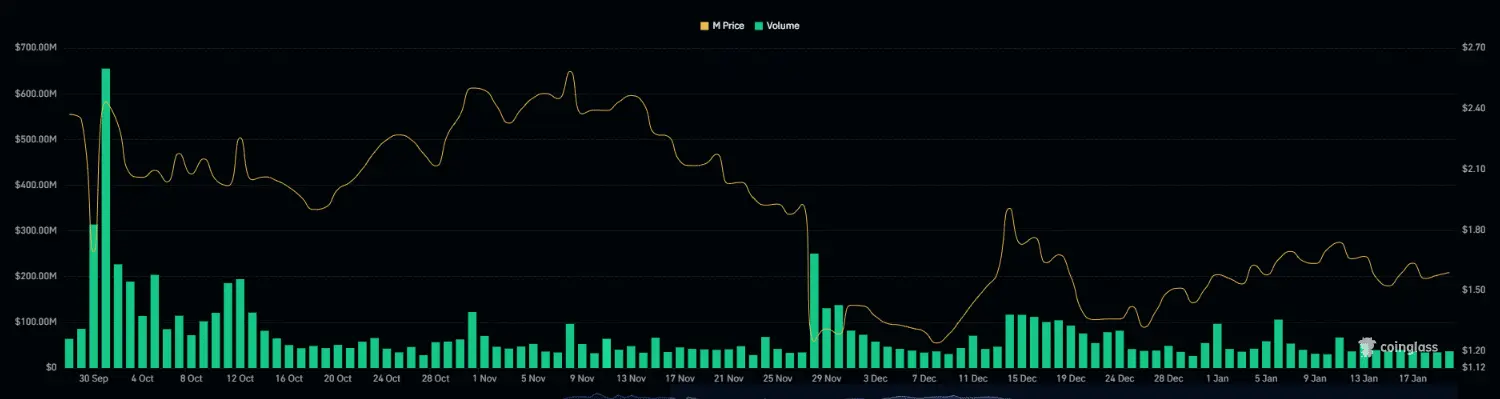 Source: Coinglass Higher trading volumes often lead to greater volatility, which could further propel a breakout if buyers continue to hold the advantage.
On-chain data issues warning signals
Although the price trend is leaning bullish, on-chain data shows signs of caution. Specifically, M’s deviation index of the price correction (DAA) is currently at -82%.
This figure reflects the discrepancy between the current price volatility and the token’s actual market value – a factor often considered a warning signal during strong price rallies.
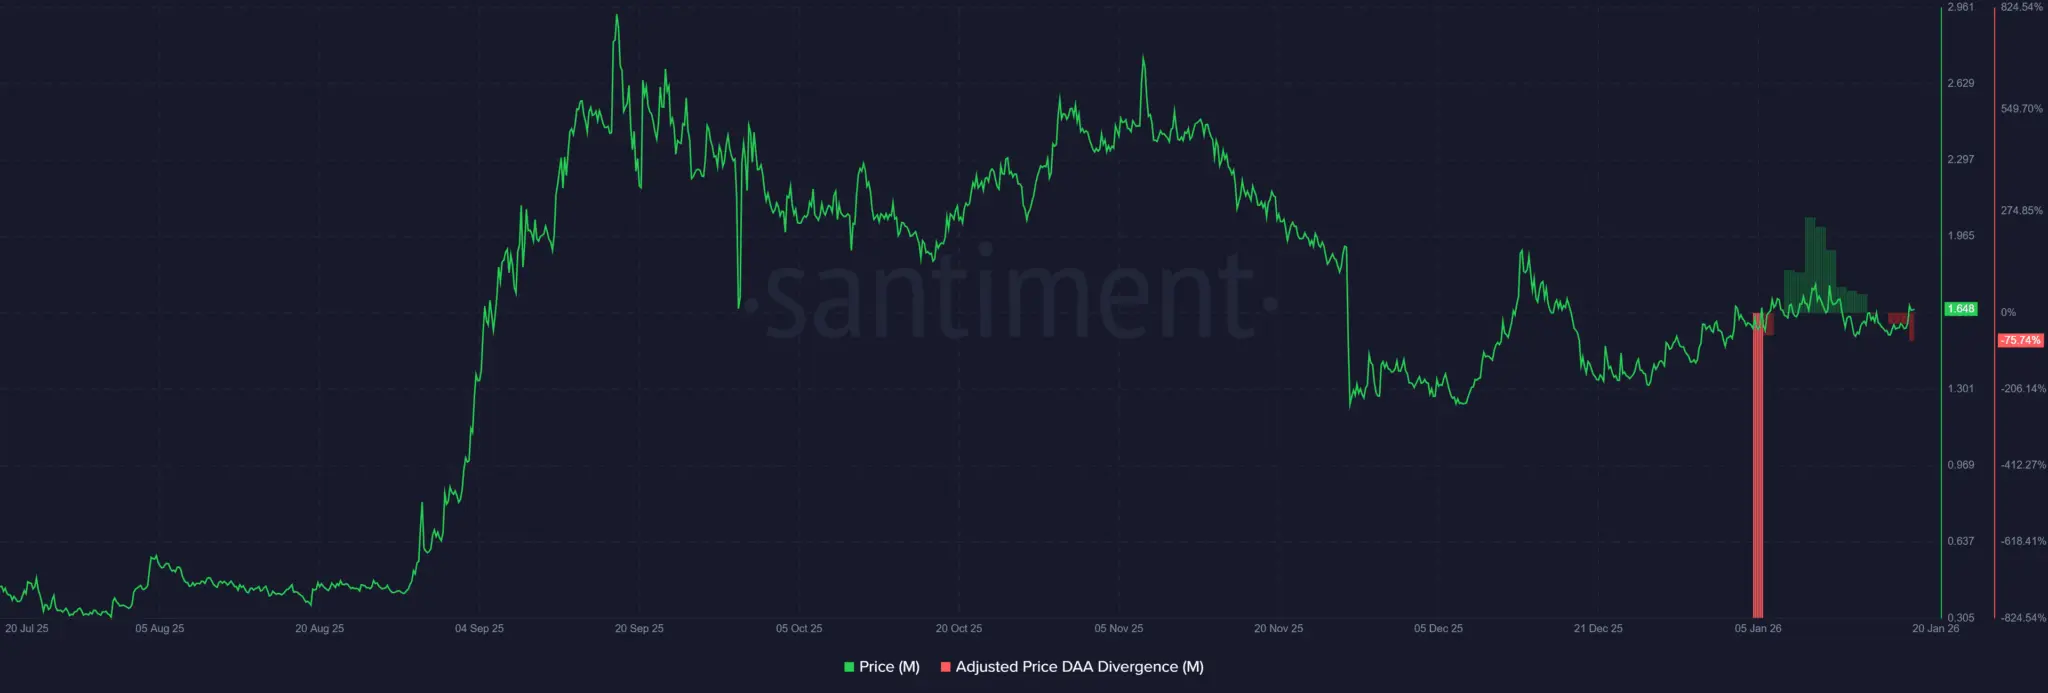 Source: Santiment A high negative ratio usually indicates a risk of the token being overvalued, which could reduce its attractiveness to investors. Overall, while M’s market structure still maintains an upward trend, this momentum could weaken if on-chain signals continue to diverge.
Disclaimer: The information on this page may come from third parties and does not represent the views or opinions of Gate. The content displayed on this page is for reference only and does not constitute any financial, investment, or legal advice. Gate does not guarantee the accuracy or completeness of the information and shall not be liable for any losses arising from the use of this information. Virtual asset investments carry high risks and are subject to significant price volatility. You may lose all of your invested principal. Please fully understand the relevant risks and make prudent decisions based on your own financial situation and risk tolerance. For details, please refer to
Disclaimer.
Related Articles
Ethereum Activity at All-Time Highs Due to Mass Capitulation - U.Today
Ethereum's network shows high activity, surpassing 2021 metrics, but this surge is due to investors selling rather than genuine demand. Liquidity is declining as users withdraw capital to exchanges, signaling potential challenges ahead.
UToday14m ago
Dogecoin Tests $0.090 Support After 3.4% Drop as Traders Watch Key Price Range
Dogecoin is currently trading at $0.09061 which is a drop of 3.4 percent, and the price is close to the important level of $0.09011 support.
The chart indicates a series of tests of the support zone of $0.089-$0.090, and the closest resistance is represented by $0.09353.
A hold of
CryptoNewsLand1h ago
PEPE Price at $0.053259 as Tight Range and Falling Volume Shape Short-Term Market Activity
PEPE was traded at $0.053259 and has recorded a 3.0 percent fall in value but it is within a thin band of support and resistance.
The market exhibited a volume of 235.15M in 24 hour trading, which is a decline of 19.16% reflecting less trading activity.
Technical indicators are not
CryptoNewsLand1h ago
XRP ETF Performance Praised as 'Really Impressive' by Bloomberg - U.Today
XRP ETFs have shown resilience amid a 45% price drop, attracting significant capital despite typical market behavior. Bloomberg's Eric Balchunas highlights strong investor support. Despite recent outflows, the funds retain substantial assets, indicating community dedication.
UToday1h ago
Crypto Shines Amid Middle East Oil Shock and Market Selloff
Bitcoin remains stable amid market turmoil fueled by rising oil prices and inflation, outperforming traditional assets. Its reduced leverage limits forced selling, attracting long-term investors eyeing potential gains in a volatile landscape.
CryptoFrontNews2h ago
XRP Holds $1.34 Support While Leverage Heatmap Highlights $1.30 Risk Zone
XRP is trading at $1.36 in a tight range of support at $1.34 and resistance at $1.37.
The heatmap data indicates that there is a huge amount of long positions in the range of $1.30.
Should prices fall to around $1.30, long positions with high leverage in this region might
CryptoNewsLand2h ago