Chainlink price action has started telling a familiar story again, one that long-term chart watchers remember from earlier cycles. LINK price has spent months moving sideways, absorbing pressure and shaking out weak hands. Recent structure changes now suggest that this quiet phase may be giving way to something more directional. The chart looks calm on the surface, yet the deeper signals show growing strength underneath.
The current LINK price analysis focuses on where price is holding rather than how fast it moves. That distinction matters during macro transitions, especially when a market shifts from survival mode into recovery.
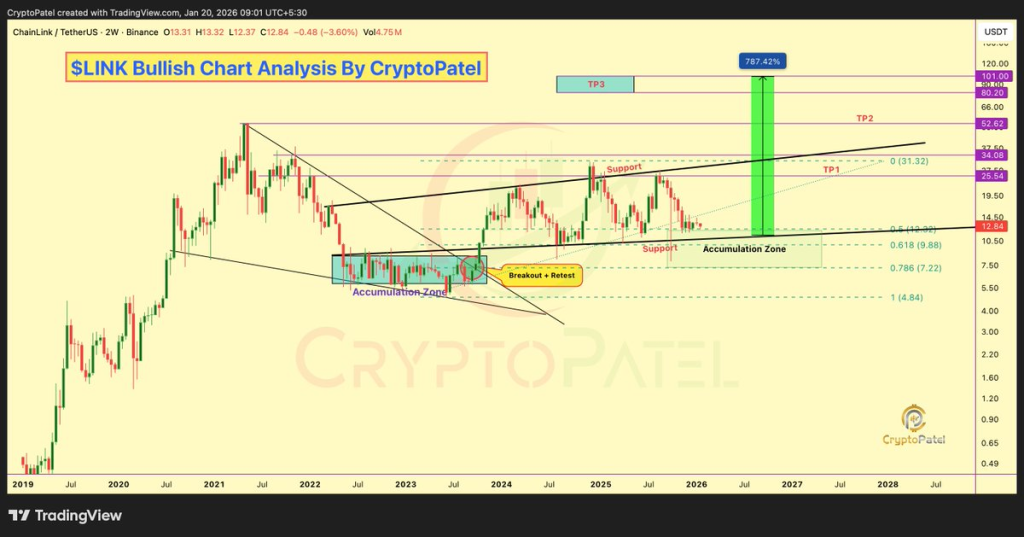
Crypto Patel, a popular crypto analyst on X, explains that LINK price is sitting inside a support zone that has played a major role since the previous cycle top. The two-week chart shows Chainlink price holding above a key Fibonacci region near $9.88, a level tied to the 0.618 retracement. Price continues to form higher lows, a structural change that often appears before trend reversals gain momentum.
Crypto Patel has highlighted how this structure resembles the early recovery phase seen after the 2021 peak. His Chainlink price prediction points to the importance of the range between $10 and $7 as a long-term accumulation area rather than a breakdown zone. LINK price remaining above this region keeps the broader bullish structure intact.
LINK Price Chart
LINK price analysis also focuses on the breakout and retest pattern that has already played out. Price pushed above long-standing resistance, pulled back to test former supply, and then stabilized. That behavior often signals acceptance rather than rejection.
According to Crypto Patel, this phase reflects accumulation rather than distribution. The gradual compression under resistance has allowed LINK to reset momentum while preserving its macro structure. Chainlink price has not shown the kind of impulsive downside that usually precedes deeper corrections, which strengthens the bullish case as long as structure remains intact.
Chainlink Price Prediction Gains Context From On Chain Data
On chain data adds another layer to the Chainlink price prediction narrative. Data from Santiment shows top LINK holding wallets increasing exposure below $13. That trend suggests long term positioning rather than short term speculation.
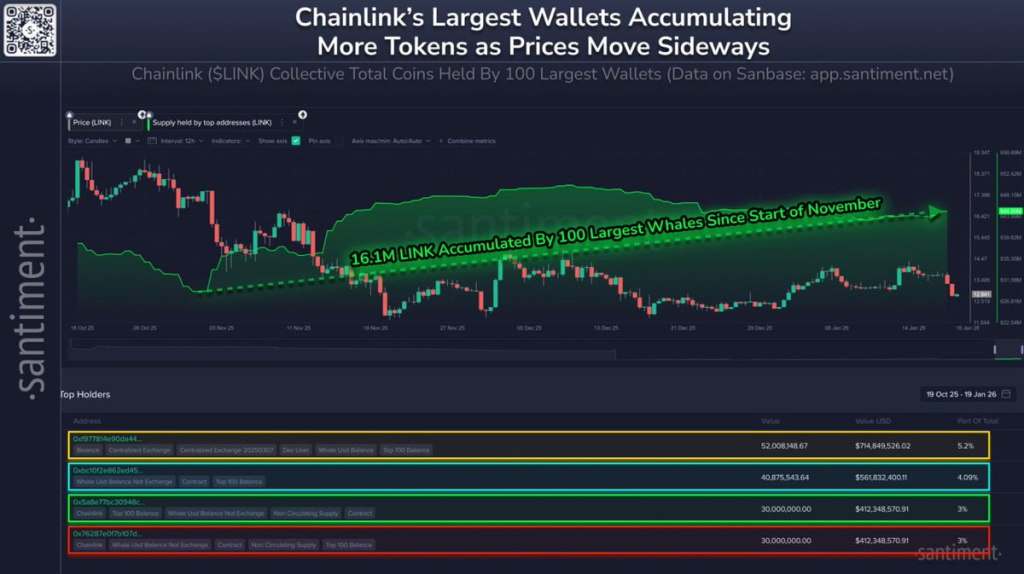
Chart Showing LINK Token Accumulation
Crypto Patel often emphasizes that accumulation phases tend to feel uneventful while they are happening. LINK price action currently reflects that behavior, with slow movement masking the broader shift in ownership. Chainlink price strength becomes more meaningful when combined with stable on-chain trends rather than isolated price spikes.
LINK Price Faces Expansion Triggers And Clear Risk Levels
LINK price now sits below a resistance band between $25 and $31, an area that could act as an expansion trigger if reclaimed. Crypto Patel outlines higher cycle targets near $31, $52, and $100 if momentum continues to build. Those projections remain conditional and depend on LINK price holding above the broader Fibonacci support zone.
India Goes All-In on Silver as Metal Stocks Explode to 11-Year Highs_**
Risk remains defined as well. A weekly close below $7 would weaken the macro structure and force a reassessment of the Chainlink price prediction narrative.
Chainlink price continues to trade at a point where patience matters more than speed. LINK price structure suggests something is developing, even if the chart has not fully revealed its hand yet. Watching how price behaves around resistance may offer clearer answers in the weeks ahead.
Disclaimer: The information on this page may come from third parties and does not represent the views or opinions of Gate. The content displayed on this page is for reference only and does not constitute any financial, investment, or legal advice. Gate does not guarantee the accuracy or completeness of the information and shall not be liable for any losses arising from the use of this information. Virtual asset investments carry high risks and are subject to significant price volatility. You may lose all of your invested principal. Please fully understand the relevant risks and make prudent decisions based on your own financial situation and risk tolerance. For details, please refer to
Disclaimer.
Related Articles
Peter Brandt: Bitcoin does not form a "cup and handle" pattern to reach $500,000
Peter Brandt, a legendary market analyst, criticizes the popular belief that Bitcoin could reach $500,000, asserting its current chart does not follow the "cup and handle" pattern. He warns that expectations based on this model lack foundation and urges better understanding of technical analysis.
TapChiBitcoin6m ago
Why did Bitcoin rise today? Oil prices plummeted 28%, ETF funds return to Bitcoin
Bitcoin has recently risen to approximately $70,000, driven by three main factors: Trump's announcement that the Iran conflict has ended, leading to a sharp drop in oil prices; the return of funds to spot Bitcoin ETFs; and MicroStrategy's large-scale Bitcoin purchases. The decline in oil prices has improved market sentiment, shifting towards risk assets, benefiting Bitcoin. On the technical side, Bitcoin faces resistance around $71,000; if it can break through, it may further rise.
MarketWhisper8m ago
Today, the cryptocurrency Fear and Greed Index rose to 15, and the market remains in a state of extreme fear.
Gate News Report, March 11 — According to Alternative.me data, the cryptocurrency Fear & Greed Index today is 15, up 2 points from yesterday's 13. The market remains in a state of "Extreme Fear."
GateNews54m ago
Elon Musk Announces X Money Launch in April, DOGE Gains 4.2% - BTC Hunts
Elon Musk announced X Money's early public access in April, enabling peer-to-peer transactions and bill payments, with potential integration of Dogecoin. Following the announcement, DOGE rose by 4.2%, amid market fluctuations and short squeezes.
BTCHUNTS1h ago
Altseason 3.0 Setup? OTHERS/BTC Retests Historic Launchpad as 4 Altcoins Prepare for Potential 5× Expansion
OTHERS/BTC retested a historic launchpad, creating a structured setup for potential 5× gains across selected altcoins.
Arbitrum, Aptos, Pepe, and Bonk exhibit consistent support and resistance patterns with measured trading volume.
Oscillators and trend lines indicate balanced momentum, s
CryptoNewsLand1h ago
Ethereum Activity at All-Time Highs Due to Mass Capitulation - U.Today
Ethereum's network shows high activity, surpassing 2021 metrics, but this surge is due to investors selling rather than genuine demand. Liquidity is declining as users withdraw capital to exchanges, signaling potential challenges ahead.
UToday4h ago