
SEI has one of those charts that starts making a lot more sense once you stop looking at it as a trend and start seeing it as a range. Price has been moving between a clear top and a clear bottom for a while now, and the latest move fits perfectly into that story.
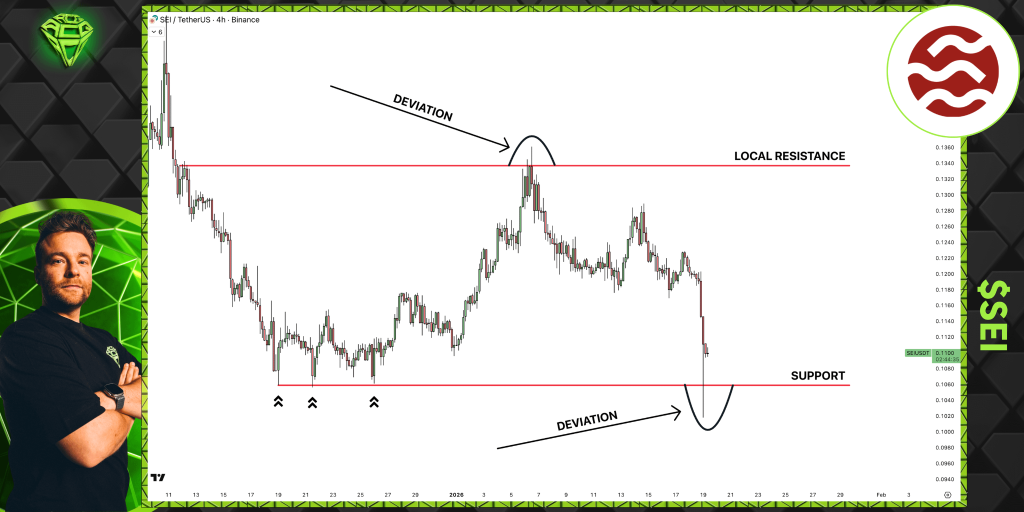
As AltCryptoGems pointed out, we’ve seen a deviation at resistance and now another one at support. When both of those show up in the same range, it usually means the market is busy clearing out liquidity before choosing a direction.
- The SEI Range Is Doing the Talking
- Why the Support Sweep Matters
- What’s Next for SEI?
The SEI Range Is Doing the Talking
If you look at the chart Sjuul shared, there’s a clear resistance zone sitting around the $0.133 to $0.134 area. That level rejected the SEI price pretty aggressively after a brief push above it.
That’s a classic deviation, where price looks like it’s breaking out, pulls in buyers, and then quickly snaps back under the level. That kind of move often tells you the market wasn’t ready to trend higher just yet, at least not on the first attempt.
Source: X/@AltCryptoGems
On the flip side, support sits down around the $0.106 to $0.107 area. That level has been tested multiple times, which is why those equal lows matter so much. Markets love targeting equal lows because that’s where stop orders pile up, and SEI did exactly that.
Why the Support Sweep Matters
After rejecting resistance, the SEI price sold off hard and briefly dipped below support. That wick below the level is important because the price didn’t stay there. It dropped, grabbed liquidity, and then climbed right back above support.
That quick reclaim changes the whole tone of the move. A clean break below support usually leads to more downside. But a deviation followed by a fast recovery often signals that sellers tried to take control and failed.
Right now, the SEI price is back above support, which puts the focus on whether buyers can actually defend this area instead of letting price slip back below it again.
Read Also: XRP Price Prediction Turns Extreme: Multi-Year Structure Points to $10+
What’s Next for SEI?
As long as the SEI price holds above that support band, the range structure remains intact. In that scenario, a rotation back toward resistance becomes the most natural path, since price has already shown it likes moving between those two levels.
If, however, the SEI price loses support again and starts closing below the $0.106 area, then the structure weakens and the market may need to build a new base before any meaningful bounce can happen.
Right now, SEI isn’t showing a clean trend in either direction. It’s showing a battle inside a range, and the market just ran a liquidity sweep at the lows. As long as the SEI price stays above support after that move, the setup leans toward another push back into the upper part of the range.
Disclaimer: The information on this page may come from third parties and does not represent the views or opinions of Gate. The content displayed on this page is for reference only and does not constitute any financial, investment, or legal advice. Gate does not guarantee the accuracy or completeness of the information and shall not be liable for any losses arising from the use of this information. Virtual asset investments carry high risks and are subject to significant price volatility. You may lose all of your invested principal. Please fully understand the relevant risks and make prudent decisions based on your own financial situation and risk tolerance. For details, please refer to
Disclaimer.
Related Articles
Aave Price Holds Near $111 After $27M Liquidation Error Shakes DeFi
Key Insights
Aave traded near $111 after a CAPO oracle configuration error triggered $27 million in liquidations across 34 wstETH-backed accounts.
Trading activity cooled as derivatives volume dropped and open interest declined, signaling that traders stepped back following the liquidation in
CryptoFrontNews16m ago
XRP Holds $1.34 Support While Leverage Heatmap Highlights $1.30 Risk Zone
XRP is trading at $1.36 in a tight range of support at $1.34 and resistance at $1.37.
The heatmap data indicates that there is a huge amount of long positions in the range of $1.30.
Should prices fall to around $1.30, long positions with high leverage in this region might
CryptoNewsLand42m ago
Crypto Market Update – River and Hyperliquid Lead Gainers As Decentralized Infrastructure Gains M...
The crypto market is displaying its typical volatility once again, yet under the noise of price movements, the beginnings of a narrative are starting to take shape. As of today, the “Top Gainers” on CoinMarketCap leans heavily towards projects targeting decentralized infrastructure and fast Layer-1s
BlockChainReporter1h ago
Solana Approaches Key Sell Wall at $84.78 — Will Momentum Hold for a Move Toward $89?
Solana is trading at an approximate price of $83.18, although a solid sell wall is at an approximate price of $84.78, which prevents upward movement.
The price is trapped between the support at $81.99 and the resistance at $84.78 which is short term consolidation.
Once buyers hit the
CryptoNewsLand1h ago
SOL Consolidates Near $84 While Chart Highlights Possible $45 Demand Zone
Solana (SOL) trades at $83.87 within a range defined by $81.03 support and $84.43 resistance, showing consolidation below a $90 supply zone. There is a broader demand area near $45, indicating potential downward movement before recovery.
CryptoNewsLand1h ago
Santiment: The surge in active USDT addresses on a certain public blockchain is correlated with the rebound of BTC
Research firm Santiment found that over the past year, when USDT active addresses on a certain public blockchain surged three times, BTC price rebounded each time, indicating that USDT liquidity has a significant impact on BTC price.
GateNews2h ago