Pump.fun (PUMP) has been cooling off during the past 3 days, yet the broader structure on the chart suggests the story may not be finished. Price action shows that PUMP had already recorded more than an 80% rise before the recent pullback, which makes the current pause look more like a breather than a breakdown. That slow but upward move that began toward the end of December is still visible when the chart is viewed as a whole.
Early price behavior matters here. PUMP spent weeks drifting lower before finding a base near the $0.0020 area. From that zone, price began forming higher lows, followed by a gradual push upward. The recent decline has not erased that structure, which is why this cooling phase is drawing attention rather than concern.
Pump.fun Price Analysis Shows A Shift After Long Term Downtrend Break
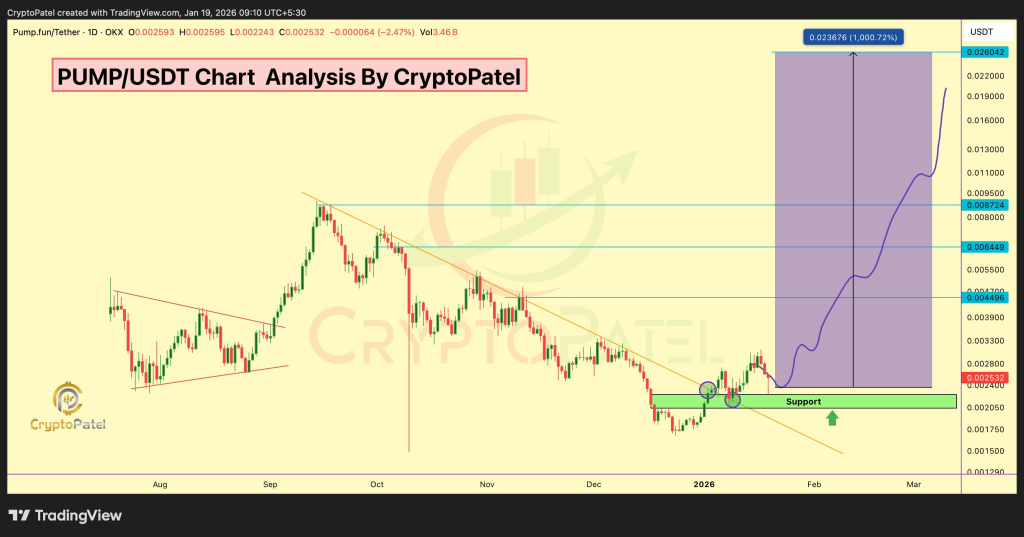
A closer look at the daily chart highlights a major technical shift. Pump.fun price recently moved above a long-term descending trendline that had capped upside attempts for months. That break often changes how a market behaves, since former resistance can start acting as support.
According to Crypto Patel, this break places PUMP inside what he describes as a bullish expansion zone. His analysis points to a completed distribution and correction phase, followed by early reversal signals. That interpretation lines up with the chart, where price stopped making lower lows and began stabilizing above the $0.0020 level.
@CryptoPatel / X
The attached chart also shows a descending wedge structure that resolved to the upside. That pattern often appears near the end of corrective phases, especially when volume starts to improve and downside momentum fades.
PUMP Price Holds Key Demand Zone That Supports Bullish Structure
One of the most important areas on the chart sits between $0.0020 and $0.0022. That zone has acted as a strong demand region, with multiple tests that failed to push price decisively lower. Each successful hold adds weight to the idea of accumulation rather than distribution.
Crypto Patel emphasizes that PUMP price remaining above $0.0020 keeps the bullish bias intact. The chart supports this view, since price has reclaimed support levels that previously acted as resistance. Those reclaims often signal that buyers are willing to step in earlier than before.
Why Bittensor (TAO) Could Be One of the Most Important AI Cryptos Ever Built_**
When projecting forward, the chart highlights several technical levels that stand out. Crypto Patel outlines upside zones around $0.00872, $0.015, and $0.026. From current levels, those targets imply a potential 500% to 1000% move if momentum continues building.
That potential does not come without risk, which is why the invalidation point matters. A daily close below $0.0020 would weaken the bullish structure and challenge the current PUMP price prediction. Until that happens, the chart continues to favor higher levels over time.
Disclaimer: The information on this page may come from third parties and does not represent the views or opinions of Gate. The content displayed on this page is for reference only and does not constitute any financial, investment, or legal advice. Gate does not guarantee the accuracy or completeness of the information and shall not be liable for any losses arising from the use of this information. Virtual asset investments carry high risks and are subject to significant price volatility. You may lose all of your invested principal. Please fully understand the relevant risks and make prudent decisions based on your own financial situation and risk tolerance. For details, please refer to
Disclaimer.
Related Articles
Bitcoin Is Entering the Best Buy Zone of This Cycle, Analyst Explains His Bullish Declaration
Bitcoin is entering the best buy zone of this cycle.
The analyst explains the reasoning behind his bullish declaration.
Can BTC surge to hit $200,000 following a successful buying phase?
The crypto market seems to be heading into a strong
CryptoNewsLand12m ago
BTC and ETH Reclaim Top Spots in Trending Cryptocurrencies List
BTC and ETH lead the trending cryptocurrency rankings, while SOL, XRP, and PEPE follow. Their prices remain volatile amid changes in gold and silver values, geopolitical tensions, and impending inflation data influencing investor behavior.
TheNewsCrypto23m ago
DeFi Lending Collapses in Cryptocurrency Space When Collateral Asset Prices Fall
DeFi lending protocols in the cryptocurrency sector have experienced a sharp decline, with the total market value decreasing by approximately 45 billion USD since October last year.
According to data from Artemis, the total amount of deposits on these platforms has decreased by 36%, from a peak of 125 billion USD in October to just 79 billion USD.
TapChiBitcoin30m ago
Bernstein: 60% of Bitcoin Unmoved for Over a Year, Long-Term Holders Remain Steadfast
A Bernstein report shows that Bitcoin retail holders have recently engaged in panic selling, but long-term holders remain steadfast, with over 60% of Bitcoin unmoved for more than a year, demonstrating confidence in Bitcoin and its characteristics as a store of value.
GateNews54m ago
Saylor Hints at Buying More Bitcoin as New Analysis States BTC Is Years Away From New ATH
Michael Saylor hints at buying more Bitcoin as new analysis comes to light.
Expert believes BTC is years away from a new ATH.
Bearish vs bullish sentiments clash.
The crypto market is in higher spirits this week as the price of pioneer crypto
CryptoNewsLand1h ago
Shiba Inu Death Cross Emerges as SHIB Price Slips Below Key Support
Key Insights
Shiba Inu confirms a death cross on the daily chart as the short term moving average drops below the long term average.
Over 112 billion SHIB moved to exchanges within two days, increasing market attention on potential selling activity and near term price pressure.
SHIB
CryptoFrontNews1h ago
