Litecoin drops below $75 to $74.52. Holding time index surge indicates active dormant wallets preparing to sell off. The long/short ratio is 0.78, favoring bears. On Saturday, it reached $81.79, but the 50-day EMA was resisted, dropping over 6%. RSI at 37 indicates oversold, MACD shows a death cross with red bars downward. If the decline continues, the target is $66.51.
Warning: Active Dormant Wallets Signal Potential Sell-Off
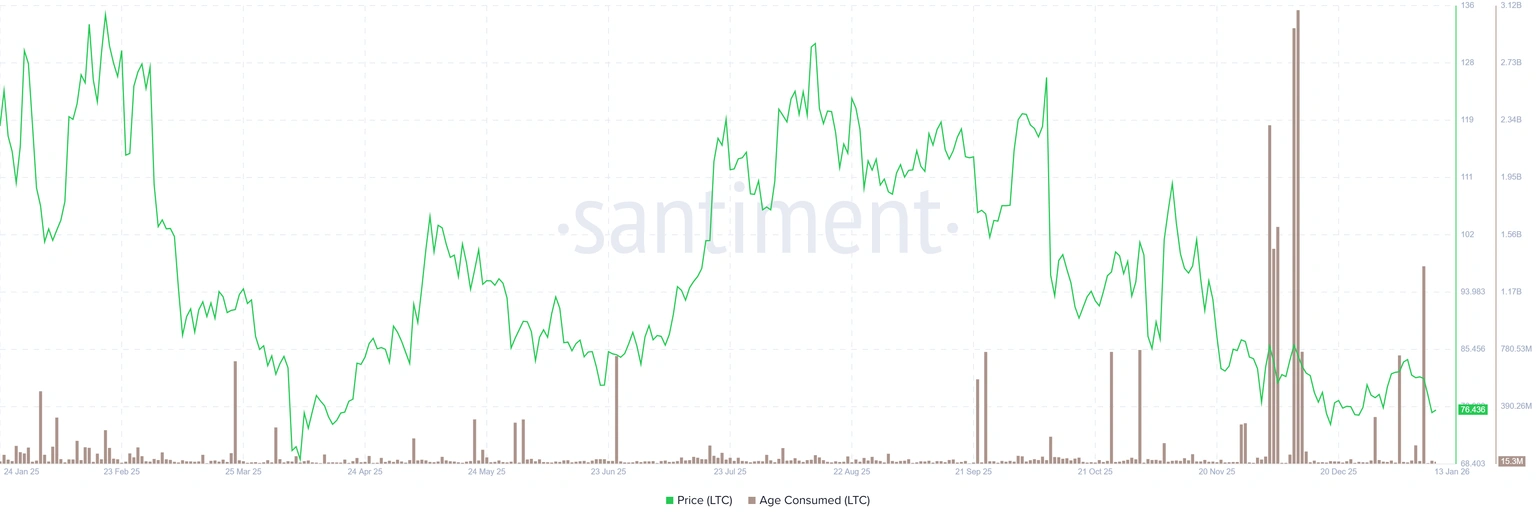
(Source: Santiment)
Santiment’s “Holding Time Index” shows a bearish signal. The surge in this index indicates that tokens long dormant (stored in wallets for a long time) are becoming active again, which can be used to identify short-term local tops or bottoms. Historical data for Litecoin shows that after price surges, it often declines as holders transfer tokens from wallets to exchanges, increasing selling pressure. The latest rebound last Saturday suggests Litecoin is ready to fall.
What is the logic behind active dormant wallets? These wallets usually belong to early investors or long-term holders with very low purchase costs. When these wallets start transferring tokens, it often means they believe current prices are high enough to take profits. Since their cost basis is far below market price, even a significant price drop still leaves them profitable, making their sell-offs highly impactful.
The surge in the Holding Time Index is seen as a sign of distribution in technical analysis. When long-term holders start selling, they often have information or market insights that retail investors lack. This “smart money” withdrawal often signals a market top. Historical data confirms that within a few weeks after the index surges, prices tend to retrace significantly.
Three Major Bearish Signals from Active Dormant Wallets
Holding Time Index Surge: Long-term dormant tokens becoming active, historically marking local tops
Long/Short Ratio 0.78: Below 1, indicating more traders are shorting, market sentiment is pessimistic
Increased Exchange Inflows: Tokens moving from wallets to exchanges, preparing for sell-off
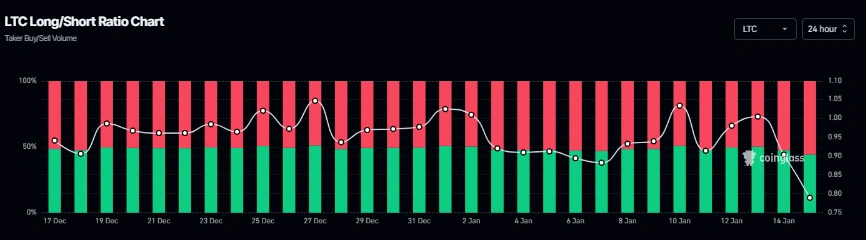
(Source: Coinglass)
According to Coinglass data, Litecoin’s long/short ratio is 0.78. This ratio below 1 reflects bearish market sentiment, as more traders are betting on a decline. The long/short ratio is a direct indicator of market mood; 0.78 means about 1.28 short positions for every long. This bearish dominance suggests any rebound could face heavy selling pressure.
As an “old coin” launched in 2011, Litecoin’s market structure differs significantly from newer coins. It has many early holders whose purchase costs could be in single digits USD. When the price is around $75, these early investors may have unrealized gains of 10x or more. Such large profit margins motivate them to sell at any price, creating structural selling pressure that Litecoin faces long-term.
RSI at 37 and MACD Death Cross Signal Technical Breakdown
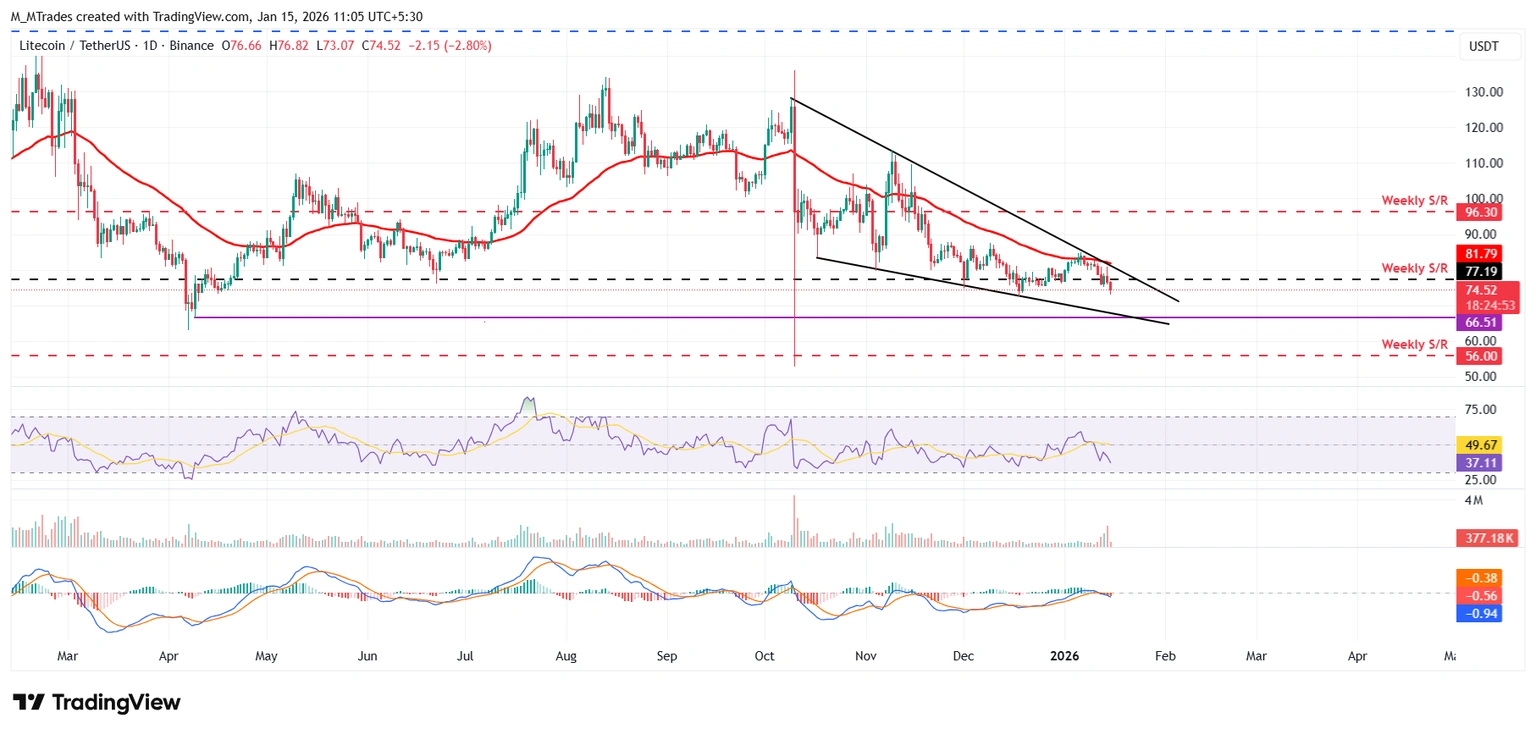
(Source: Trading View)
Litecoin’s price was resisted below the 50-day exponential moving average (EMA) of $81.79 on Saturday, and before Wednesday, it fell over 6%. As of Thursday, the price was $74.52. The Relative Strength Index (RSI) on the daily chart is 37, below the neutral 50, indicating oversold conditions and strong downward momentum. Additionally, the MACD showed a death cross on Monday, with red bars extending below the neutral level, further confirming a negative outlook.
An RSI of 37 suggests Litecoin is approaching oversold territory (typically below 30). But “approaching oversold” does not mean “about to rebound,” as in strong downtrends, RSI can stay in oversold zones for weeks or months. The current 37 reading indicates continued selling pressure but not panic selling. This “mild but persistent” decline is often more damaging than a quick bounce after a sharp drop, as it erodes investor confidence over time.
The MACD death cross is a more serious bearish signal. The MACD, composed of the fast line (12-day EMA) and slow line (26-day EMA), signals a downtrend when the fast line crosses below the slow line. The death cross formed on Monday indicates momentum has turned fully negative. The red bars extending below the neutral level show accelerating bearish strength.
If LTC continues to fall, it may test the April 9 low of $66.51. From the current $74.52 to $66.51, there is about an 11% downside, representing further painful losses for holders. $66.51 is a key low in 2025; if broken, it could enter uncharted territory, possibly testing $60 or lower.
Conversely, if LTC recovers, it could rally toward the weekly resistance at $77.19. This rebound scenario is less likely but not impossible. If overall market sentiment improves (e.g., Bitcoin breaks $100,000), Litecoin might follow. But considering active dormant wallets and the imbalance in long/short ratio, any rebound could be a chance to reduce positions rather than a trend reversal.
From a long-term perspective, Litecoin faces an identity crisis. As “Bitcoin’s silver” and an early payment-focused cryptocurrency, Litecoin was among the top five market cap coins in 2017. But with the rise of new blockchains like Solana and Avalanche, and the development of Bitcoin’s Lightning Network, Litecoin’s payment advantage has diminished. It lacks Ethereum’s smart contract ecosystem and Bitcoin’s store of value consensus, gradually becoming an “undistinct old coin.” This weakening fundamental makes it harder to attract new capital, and the activity of dormant wallets will only accelerate its value decline.
Disclaimer: The information on this page may come from third parties and does not represent the views or opinions of Gate. The content displayed on this page is for reference only and does not constitute any financial, investment, or legal advice. Gate does not guarantee the accuracy or completeness of the information and shall not be liable for any losses arising from the use of this information. Virtual asset investments carry high risks and are subject to significant price volatility. You may lose all of your invested principal. Please fully understand the relevant risks and make prudent decisions based on your own financial situation and risk tolerance. For details, please refer to
Disclaimer.
Related Articles
GROK Corrects to $0.0004846, Gets Ready for Next Leg Up With 100% Spike Ahead: Analyst
The GROK coin is attracting market attention due to its latest exciting price action. With its ongoing consolidation, the analyst CryptoGems2016 believes that the crypto asset is almost ready to experience moves on the massive upside.
The Grok (GROK) coin is a meme coin cryptocurrency named after
BlockChainReporter13m ago
Aave Price Holds Near $111 After $27M Liquidation Error Shakes DeFi
Key Insights
Aave traded near $111 after a CAPO oracle configuration error triggered $27 million in liquidations across 34 wstETH-backed accounts.
Trading activity cooled as derivatives volume dropped and open interest declined, signaling that traders stepped back following the liquidation i
CryptoFrontNews1h ago
Cardano Price Holds Above $0.26 as Upgrade Buzz Builds Toward $0.30
Key Insights
Cardano price trades above $0.26 as investors position ahead of the Leios and Midnight upgrades, while derivatives data reflect rising bullish sentiment.
Futures open interest reached $416 million while funding rates favor long positions, signaling stronger trader confidence des
CryptoFrontNews1h ago
Cardano’s 307% Rally Started With This Signal – And ADA Price Just Flashed It Again
Cardano has been quietly building something that caught the interest of technical analysts. After months of grinding sideways and frustrating holders, the ADA price finally showed signs of life.
The move caught many off guard, but for those watching the charts, the signal was impossible to
CaptainAltcoin1h ago
XRP Price Structure Tightens While Heatmap Highlights $1.30 Liquidity Zone
XRP trades near $1.37 support after a 0.9% daily decline, while the $1.44 level remains the immediate resistance in the current range.
A three-week liquidity heatmap highlights a large order cluster around $1.30, indicating a strong liquidity zone below price.
A three-month Gaussian
CryptoNewsLand1h ago
Billionaire Investor Stanley Druckenmiller Bullish on Stablecoin Growth
Billionaire investor Stanley Druckenmiller believes stablecoins will become the backbone of the financial system in 10-15 years, citing their efficiency. However, he views much of the wider crypto market as unnecessary, describing it as “a solution looking for a problem.”
Decrypt2h ago