
Date: 10 Jan 2026, 05:40 AM GMT
Key Highlights
-
Bitcoin Cash (BCH) is undergoing a healthy pullback after a strong breakout from a rounded bottom pattern.
-
Price is currently retesting the former resistance zone around $600–$625, now acting as key support.
-
The recent breakout pushed BCH to a local high near $669, confirming bullish momentum.
-
As long as BCH holds above the $600 region, the broader structure remains bullish despite short-term market weakness.
-
A successful rebound from the retest could open the door for a continuation move toward the $800 region.
The broader cryptocurrency market is taking a pause after a strong start to the year. Bitcoin (BTC), which recently surged close to the $94,000 mark, has pulled back below $90,000, slightly weighing on overall market sentiment. Ethereum (ETH) is also trading in the red, reflecting mild profit-taking across major assets.
Amid this short-term weakness, Bitcoin Cash (BCH) is also trading lower on the day. However, beneath the surface, the technical structure remains constructive, as price is currently retesting a key bullish breakout — a setup that often precedes another leg higher if support holds.
Source: Coinmarketcap
BCH Retests Rounded Bottom Breakout
On the daily chart, Bitcoin Cash recently completed a textbook rounded bottom formation, a classic bullish reversal pattern that typically signals a shift from prolonged consolidation to trend continuation.
As illustrated on the chart, BCH successfully broke above the neckline resistance zone around $600–$625, triggering a strong impulsive move that pushed price to a local high near $669. Following this rally, BCH entered a controlled pullback — a normal and healthy reaction after a breakout — bringing price back toward the former resistance area.
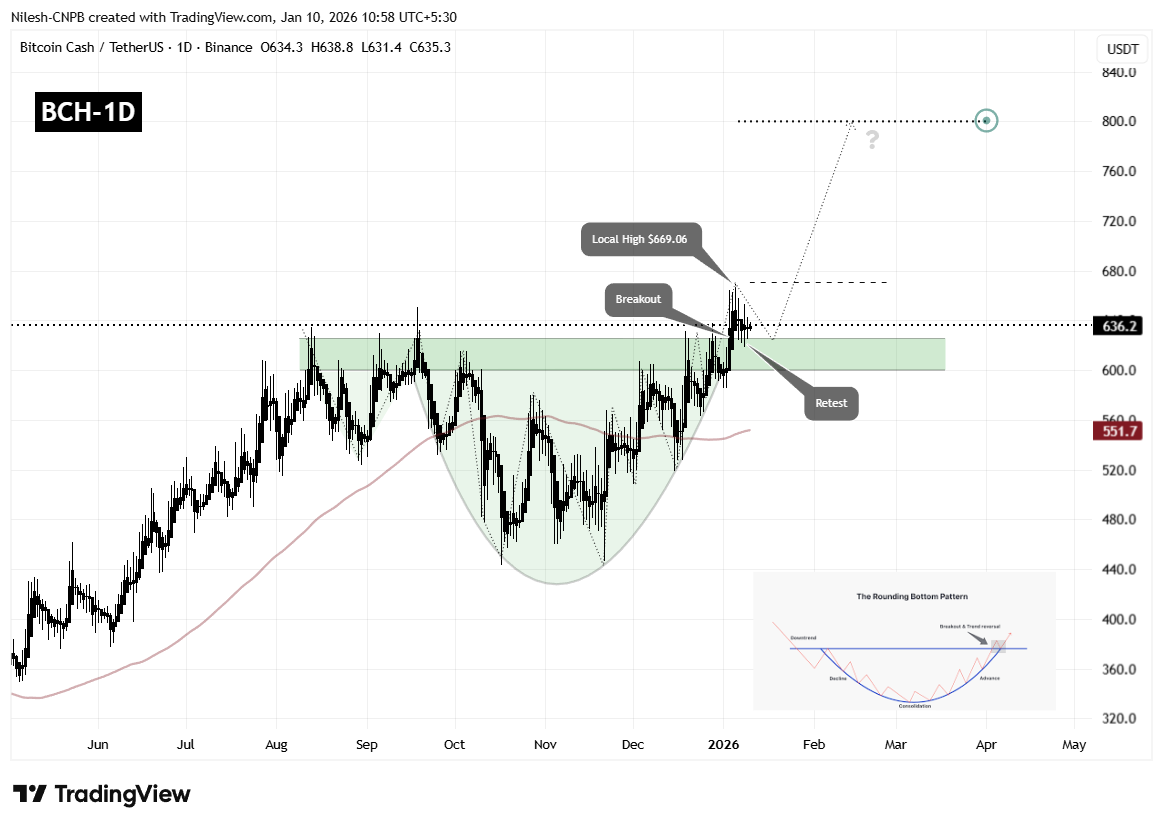
Bitcoin Cash (BCH) Daily Chart/Coinsprobe (Source: Tradingview)
Currently, BCH is trading near the $625 level, which is now acting as resistance-turned-support. This zone also aligns with the highlighted demand area on the chart, making it a technically important region for determining the next directional move.
What the Chart Suggests Next for BCH
The ongoing retest phase remains constructive as long as buyers continue to defend the $600–$625 support zone. Holding above this region would indicate that market participants are using the pullback as an opportunity to accumulate rather than exit positions.
If bullish momentum resumes from this level, the first key upside objective would be a reclaim of the $669 local high. A decisive move above this level would strengthen bullish control and confirm the breakout-retest structure.
Based on the measured move projection of the broader rounding bottom formation, a successful continuation could push BCH toward the $800 region. This target aligns with the projected extension shown on the chart and represents roughly 25% upside from the breakout zone.
On the downside, failure to hold above the $600 support area would weaken the bullish setup and raise the risk of a deeper pullback, potentially turning the recent breakout into a failed move.
For now, the price structure favors patience. As long as BCH maintains support and avoids a strong rejection from this retest zone, the broader technical outlook continues to lean bullish despite short-term market volatility.
Bottom Line
Bitcoin Cash remains technically constructive despite short-term downside pressure across the broader crypto market. The ongoing retest of the rounded bottom breakout is a critical phase, often seen in strong bullish continuations. Holding above the $600–$625 zone keeps the bullish structure intact and increases the probability of a renewed push higher. While failure to defend this area could invite deeper pullbacks, the current price action suggests that BCH is still positioning for a potential bounce and trend continuation.
Frequently Asked Questions (FAQ)
What is happening with Bitcoin Cash (BCH) right now?
Bitcoin Cash is currently retesting a key breakout level after completing a rounded bottom pattern on the daily chart. This pullback is considered healthy and often occurs after strong bullish moves.
Why is the $600–$625 zone important for BCH?
This zone previously acted as resistance during consolidation and has now flipped into support after the breakout. Holding above this area is critical for maintaining the bullish structure.
What does a rounded bottom pattern indicate?
A rounded bottom pattern typically signals a long-term trend reversal from bearish to bullish. When followed by a successful breakout and retest, it often leads to strong continuation moves.
What are the bullish targets for Bitcoin Cash?
If BCH holds the current support and reclaims the $669 local high, the chart structure suggests a potential upside move toward the $800 region over the coming weeks.
What could invalidate the bullish setup?
A decisive breakdown below the $600 support area would weaken the bullish thesis and could lead to a deeper correction, potentially turning the breakout into a failed move.
Is this a good time to invest in BCH?
This analysis is based on technical chart structure and market behavior. Investors should conduct their own research and assess risk tolerance before making any investment decisions.
Disclaimer: The views and analysis presented in this article are for informational purposes only and reflect the author’s perspective, not financial advice. Technical patterns and indicators discussed are subject to market volatility and may or may not yield the anticipated results. Investors are advised to exercise caution, conduct independent research, and make decisions aligned with their individual risk tolerance.
About Author: Nilesh Hembade is the Founder and Lead Author of Coinsprobe, with over 5 years of experience in the cryptocurrency and blockchain industry. Since launching Coinsprobe in 2023, he has been providing daily, research-driven insights through in-depth market analysis, on-chain data, and technical research.
Disclaimer: The information on this page may come from third parties and does not represent the views or opinions of Gate. The content displayed on this page is for reference only and does not constitute any financial, investment, or legal advice. Gate does not guarantee the accuracy or completeness of the information and shall not be liable for any losses arising from the use of this information. Virtual asset investments carry high risks and are subject to significant price volatility. You may lose all of your invested principal. Please fully understand the relevant risks and make prudent decisions based on your own financial situation and risk tolerance. For details, please refer to
Disclaimer.
Related Articles
Here’s HBAR Price if Hedera’s AI Integration With Claude Drives Enterprise Adoption
Hedera (HBAR) latest developments suggest steady institutional interest beneath a consolidating price. The network has continued to attract capital and enterprise partners even as the broader crypto market remains volatile.
ETF inflows are one sign of that trend. On 4 March 2026, Canary’s
CaptainAltcoin16m ago
"Smart money" goes against the panic: Why did Chainlink become a safe haven in the March market?
Chainlink experiences a capital outflow in the crypto market, with active development activity indicating potential resilience and long-term value. Although current market sentiment is fragile, LINK needs to break through the $9.17 resistance level to confirm an upward trend. Overall, investors should stay attentive and wait for market stabilization or positive signals from LINK itself before making decisions.
PANews38m ago
Stellar (XLM) recovers, the bulls approach the breakout point of the trendline
Stellar (XLM) is trading around $0.155, showing a slight recovery, but trader sentiment remains cautious amid mixed on-chain and derivatives data. A successful breakout above the current downtrend could support short-term gains.
TapChiBitcoin49m ago
PI (Pi) increased by 7.62% over the past 24 hours
Gate News Report, March 11 — According to Gate Market Data, as of press time, PI (Pi) is trading at $0.23, up 7.62% in the past 24 hours, with a high of $0.24 and a low of $0.17. The current market capitalization is approximately $2.248 billion, an increase of $159 million from yesterday.
Pi Network is a blockchain community and developer platform dedicated to enabling users to mine Pi tokens easily on their phones through innovative technology. Centered around its groundbreaking technology, the network allows mining via mobile apps without consuming大量电力, making it the first digital currency that can be mined on a mobile device. Pi Network emphasizes decentralization, mobile-first design, and environmental friendliness, aiming to involve more users in the cryptocurrency ecosystem.
##
GateNews1h ago
TRUMP Meme Coin Plummets 96% from Peak, Trump Polls Worsen, Accelerating Collapse
TRUMP Token recently dropped to $2.87, with a total decline of over 96%, hitting a record low. Its decline is related to the sharp drop in President Trump's approval ratings, indicating that waning political enthusiasm has a significant impact on token valuation. The market is sensitive to geopolitical volatility, and with WLFI tokens also under pressure, it demonstrates the high-risk nature of political-themed meme coins.
MarketWhisper1h ago