
Date: 11 Jan 2026, 06:20 PM GMT
Key Highlights
-
Pump.fun (PUMP) posts over 6% intraday gains as broader crypto market sentiment improves.
-
The 4H chart shows a bearish ABCD harmonic pattern, with the bullish CD leg currently in play.
-
Price rebounded strongly from the 100-period moving average, reinforcing trend strength.
-
The pattern projects a potential upside move toward the $0.00296 region.
-
Holding above the $0.00225 support zone remains critical to sustain the bullish structure
The broader cryptocurrency market has regained modest upward momentum today, with both Bitcoin (BTC) and Ethereum (ETH) returning to positive territory. This improvement in sentiment has helped stabilize the altcoin space, and Pump.fun (PUMP) is emerging as one of the stronger performers, posting over a 6% intraday gain.
Beyond the short-term price bounce, PUMP’s chart structure is beginning to show a technically constructive setup that suggests additional upside could be developing.

Source: Coinmarketcap
Harmonic Pattern Signals Bullish Continuation
On the 4-hour timeframe, PUMP appears to be forming a bearish ABCD harmonic pattern — a structure that often develops during the later stages of an uptrend. While this pattern can eventually signal a reversal once the final leg completes, the CD leg itself is typically driven by strong bullish momentum, often producing notable upside before any exhaustion sets in.
As illustrated on the chart, the pattern initiated at Point A near $0.00179, followed by a sharp impulsive rally into Point B around $0.00272. Price then entered a corrective phase, pulling back toward Point C near $0.00203.
Importantly, this retracement aligned closely with the 100-period moving average, where buyers stepped in decisively. The swift reaction from this zone reinforced the strength of the underlying trend and helped preserve the harmonic structure.
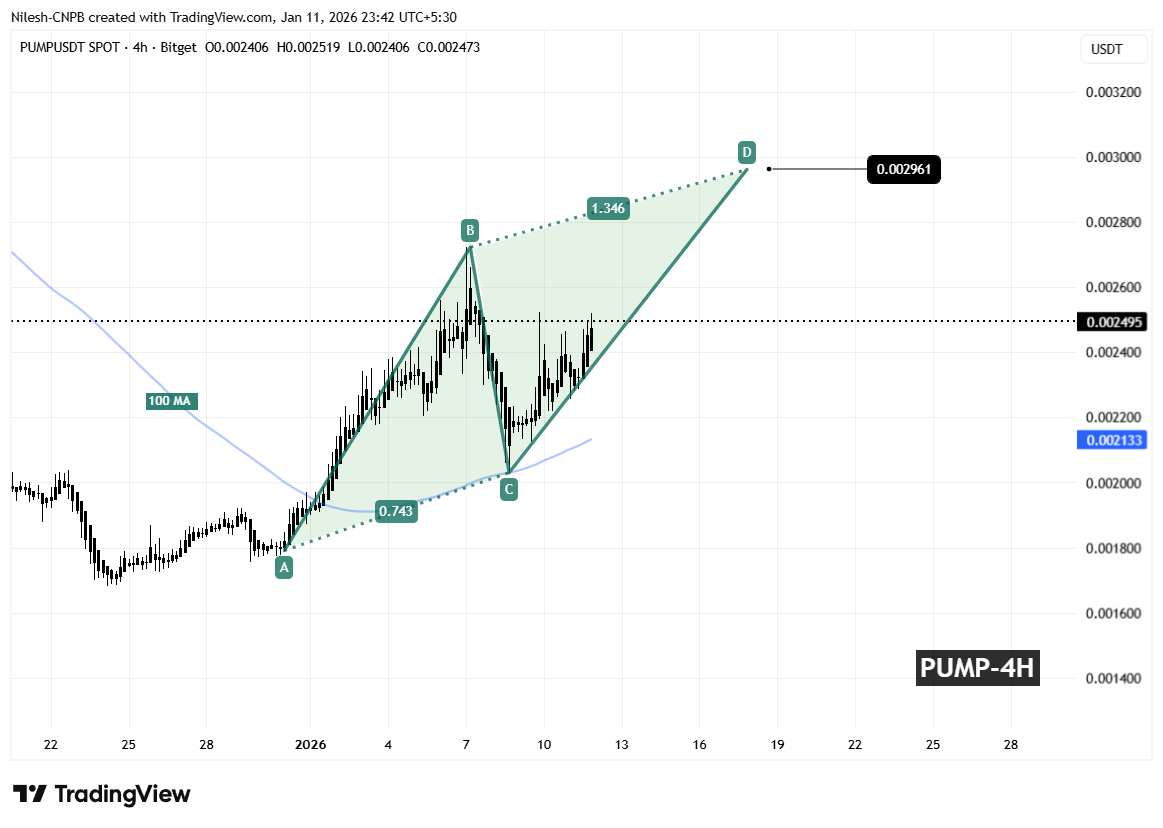
Pump.fun (PUMP) 4H Chart/Coinsprobe (Source: Tradingview)
Since bouncing from Point C, PUMP has resumed its advance and is now trading back around the $0.0025 area, signaling that the CD leg is actively unfolding.
What Could Come Next for PUMP?
If the ABCD pattern continues to play out as projected, the CD leg could extend toward the 1.346 Fibonacci projection of the BC segment. This places the Potential Reversal Zone (PRZ) near $0.00296, which sits roughly 18% above current price levels.
This zone is typically where traders begin to watch for signs of short-term exhaustion or profit-taking, as harmonic patterns often complete around these extensions. Until then, momentum favors the bulls, provided the structure remains intact.
From a risk perspective, holding above the $0.00225 support region will be crucial. A decisive breakdown below this level would weaken the harmonic setup and increase the likelihood of renewed downside pressure.
For now, PUMP’s price action remains technically constructive, with buyers defending key levels and momentum pointing toward a possible continuation higher before any broader consolidation or reversal attempt emerges.
Frequently Asked Questions (FAQ)
What is driving Pump.fun (PUMP) price higher today?
PUMP is benefiting from improving overall market sentiment and a bullish harmonic structure on the 4-hour chart, supported by strong buying interest near the 100-period moving average.
What pattern is forming on the PUMP chart?
The chart indicates a bearish ABCD harmonic pattern. While such patterns can lead to reversals at completion, the CD leg often produces strong bullish momentum before that point.
What is the upside target for Pump.fun (PUMP)?
If the CD leg continues, the projected upside target lies near the $0.00296 level, which aligns with the 1.346 Fibonacci extension.
Is Pump.fun (PUMP) still bullish in the short term?
As long as price remains above key support and momentum holds, the short-term outlook remains cautiously bullish.
Disclaimer: The views and analysis presented in this article are for informational purposes only and reflect the author’s perspective, not financial advice. Technical patterns and indicators discussed are subject to market volatility and may or may not yield the anticipated results. Investors are advised to exercise caution, conduct independent research, and make decisions aligned with their individual risk tolerance.
About Author: Nilesh Hembade is the Founder and Lead Author of Coinsprobe, with over 5 years of experience in the cryptocurrency and blockchain industry. Since launching Coinsprobe in 2023, he has been providing daily, research-driven insights through in-depth market analysis, on-chain data, and technical research.
Disclaimer: The information on this page may come from third parties and does not represent the views or opinions of Gate. The content displayed on this page is for reference only and does not constitute any financial, investment, or legal advice. Gate does not guarantee the accuracy or completeness of the information and shall not be liable for any losses arising from the use of this information. Virtual asset investments carry high risks and are subject to significant price volatility. You may lose all of your invested principal. Please fully understand the relevant risks and make prudent decisions based on your own financial situation and risk tolerance. For details, please refer to
Disclaimer.
Related Articles
Polkadot Holds $1.46 Support as Descending Channel Caps Upside Near $1.53
The heaviest resistance is at the 4-hour chart where DOT trades within a downward channel and resistance levels are formed near the levels of $1.50-$1.53.
The nearest support is at $1.46 and a more profound zone of demand is at the range of $1.38 to $1.40.
Even with a 1.5 price drop, DOT
CryptoNewsLand1m ago
DOGE Price Prediction: Elon Musk Drops X Money News and Dogecoin Immediately Pumps
The Dogecoin price shot up 10% today after Elon Musk announced that X Money early public access starts in April.
DOGE is now trading near $0.0985, just below the key $0.10 level that traders are watching closely.
Musk’s X Money News Sparks Immediate Rally
Where Is the D
CaptainAltcoin46m ago
BTC breaks through $71,500, rising 4.5% in a single day, with multiple analysts' opinions diverging
March 10th, Bitcoin rose approximately 4.5%, breaking through $71,500. Despite tense tensions in the Middle East, analysts have differing views on the future market. Some believe the short-term bulls are in the lead, while others remain cautious of a potential pullback and are watching key support levels.
GateNews1h ago
Bitcoin Rises as Trump Amplifies Iran Threats, Fed Rate Cut Chances Fall Near Zero
Bitcoin's price hovers near $71,000 despite a 3% increase, as geopolitical tensions and the Federal Reserve's rate policy create market uncertainty. Oil prices have declined from recent peaks, and crypto markets face liquidation pressures amid mixed investor sentiment.
Decrypt2h ago
Crypto and TradFi Divergence Defines 2026 Market Resilience Amidst Bitcoin Sell-Off
March 2026 as traditional equities and digital assets fell sharply apart. In the first quarter A decoupling is being witnessed that challenges the notion of Bitcoin as a high-beta proxy for the stock market. After a year-end sell-off and a plunge from its 2025 highs, the S&P 500 (SPX) has shown
BlockChainReporter2h ago
ETH 15-minute increase of 1.02%: Ecosystem upgrade expectations resonate with active buying, driving the rally
From 14:30 to 14:45 (UTC) on March 10, 2026, ETH recorded a short-term gain of +1.02%, with the price rising from 2024.3 USDT to 2047.18 USDT, an amplitude of 1.13%. Trading volume during this period significantly increased, with active addresses rising from 12,800 to 15,600, and large on-chain transfers up by 30.2%, reflecting a notable increase in market attention and volatility.
The main driver of this movement is the Ethereum "Verde" technical upgrade testnet news.
GateNews2h ago