
**Date: **Fri, Jan 02, 2026 | 06:40 PM GMT
The broader cryptocurrency market has started the new year with modest strength, as both Bitcoin (BTC) and Ethereum (ETH) trade in the green with gains of over 2%. While several altcoins are regaining momentum, the privacy-focused token Monero (XMR) has remained relatively flat in comparison.
XMR is trading with mild gains, but more importantly, its daily chart structure suggests the recent pullback may be a healthy bullish retest rather than a sign of trend exhaustion.
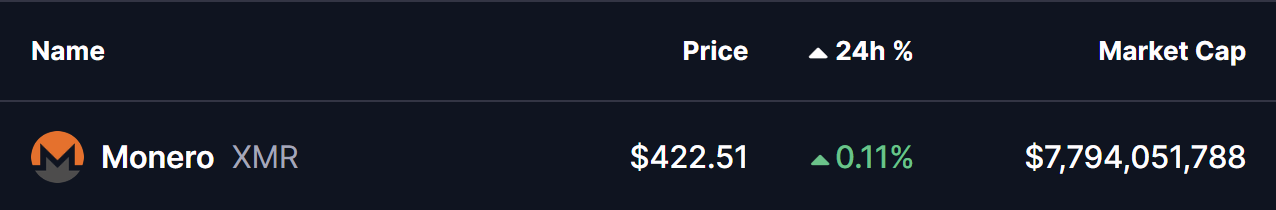
Source: Coinmarketcap
Retesting the Cup and Handle Breakout
On the daily timeframe, XMR had been consolidating within a well-defined Cup and Handle pattern — a classic bullish continuation formation that often precedes strong upside moves once the neckline is cleared.
Earlier, bulls decisively broke above the $412–$420 neckline resistance, triggering a sharp rally of nearly 20% from the breakout base to a local high around $498.30. This move confirmed the pattern’s validity and signaled a clear shift in market structure toward the upside.
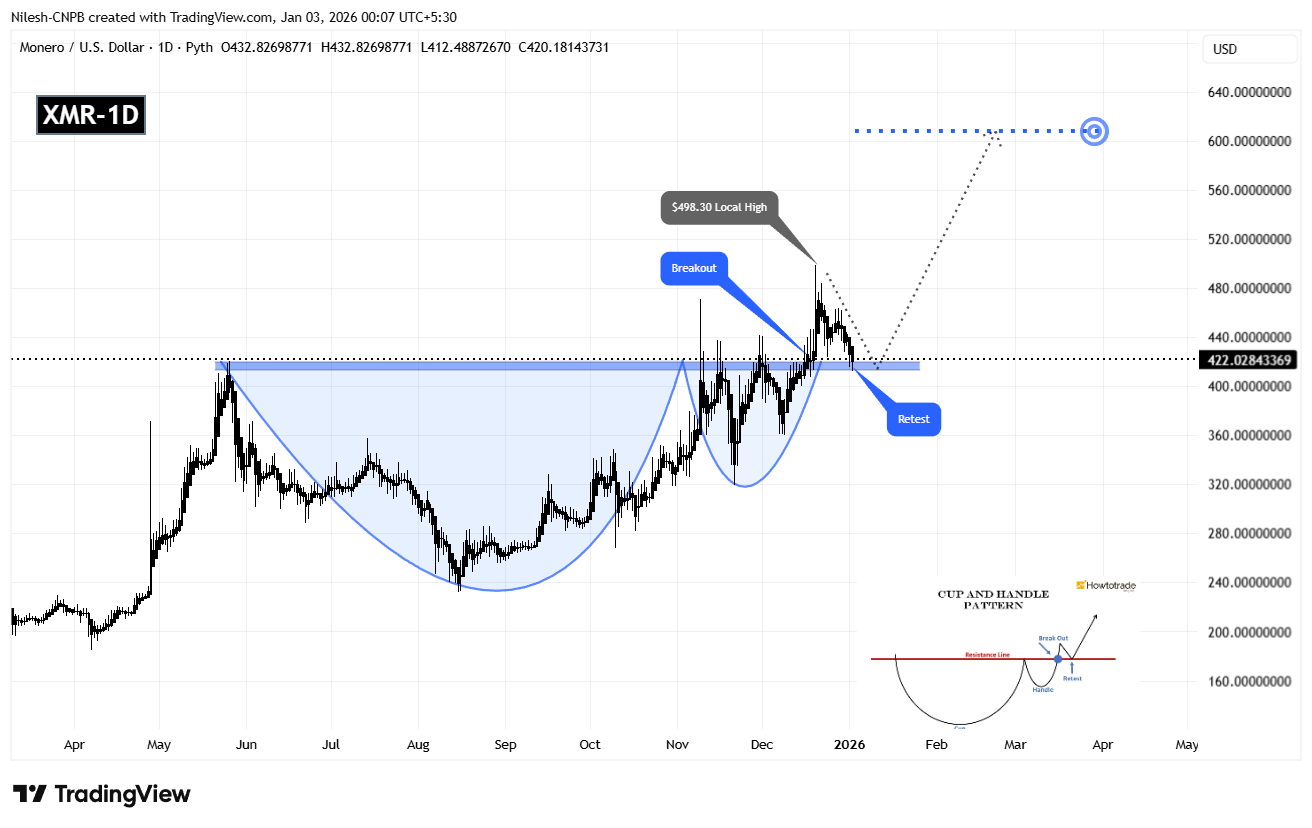
Monero (XMR) Daily Chart/Coinsprobe (Source: Tradingview)
Following that initial breakout surge, XMR entered a natural cooldown phase. The recent dip has brought price back toward the $412–$420 zone, where buyers have stepped in once again. This area now acts as a textbook resistance-turned-support level. Such retests are common after strong breakouts and often serve as a launchpad for the next impulsive move if demand holds firm.
What’s Next for XMR?
As long as buyers continue to defend the $412–$420 neckline zone, the broader bullish structure remains intact. A sustained push back above the recent swing high near $498 would likely signal renewed momentum and confirm continuation of the breakout.
Based on the depth of the cup formation, the technical upside projection points toward the $608 region. This would represent a potential upside of roughly 43% from current levels if momentum accelerates.
On the downside, a failure to hold the $412–$420 support range could temporarily weaken bullish momentum and delay the continuation scenario. However, the larger structure would still remain constructive as long as price stays well above the cup’s base.
For now, XMR appears to be in a crucial confirmation phase. How price reacts around this key support zone in the coming sessions will likely determine whether Monero transitions into a full-scale continuation rally or spends more time consolidating before its next move.
Disclaimer: The views and analysis presented in this article are for informational purposes only and reflect the author’s perspective, not financial advice. Technical patterns and indicators discussed are subject to market volatility and may or may not yield the anticipated results. Investors are advised to exercise caution, conduct independent research, and make decisions aligned with their individual risk tolerance.
About Author: Nilesh Hembade is the Founder and Lead Author of Coinsprobe, with over 5 years of experience in the cryptocurrency and blockchain industry. Since launching Coinsprobe in 2023, he has been providing daily, research-driven insights through in-depth market analysis, on-chain data, and technical research.
Disclaimer: The information on this page may come from third parties and does not represent the views or opinions of Gate. The content displayed on this page is for reference only and does not constitute any financial, investment, or legal advice. Gate does not guarantee the accuracy or completeness of the information and shall not be liable for any losses arising from the use of this information. Virtual asset investments carry high risks and are subject to significant price volatility. You may lose all of your invested principal. Please fully understand the relevant risks and make prudent decisions based on your own financial situation and risk tolerance. For details, please refer to
Disclaimer.
Related Articles
Is this the perfect buying point for Bitcoin? PlanB updates the S2F model: the average price in this cycle is expected to reach $500,000
Quantitative analyst PlanB has made a new Bitcoin forecast, estimating that the average price from 2024 to 2028 will reach $500,000, based on its S2F model. The model calculates scarcity through asset stock and annual production, indicating that the market is currently entering a buying opportunity. PlanB emphasizes the historical accuracy of the forecast but also acknowledges the model's blind spots and the need to pay attention to market demand changes.
区块客1m ago
Mining one Bitcoin results in a loss of 20,000! Miners collectively shift to AI, rewriting the Bitcoin mining model
Bitcoin mining faces losses in 2026, prompting mining companies to pivot to AI to address market challenges. Many enterprises are liquidating Bitcoin assets and reallocating resources to AI data centers, as the profit potential of AI is highly regarded. Data shows that this shift could have a positive impact on Bitcoin's long-term supply structure, and market sentiment also indicates potential rebound signals. Although this transformation may temporarily affect hash rate growth, in the long run, it will enhance the resilience and security of the Bitcoin network.
MarketWhisper12m ago
Solana Price Prediction: 30 Institutions Bet $540 Million on Solana ETF, Can SOL Hold $80 and Break $100?
Although Solana (SOL) has recently maintained stable prices, approximately 30 institutional investors collectively hold around $540 million in Solana ETF positions, indicating interest in long-term investment. Currently, SOL is fluctuating around $80 to $90, with $80 being a key support level. A break below could signal a drop below $64. Analysts believe that institutional capital inflows will influence SOL's future performance.
GateNews14m ago
Bitcoin Price Prediction: Wall Street Funds Flow Back into BTC, ETF Attracts $167 Million in a Single Day, Altcoin Funds Continue to Withdraw
Institutional funds are flowing back into the Bitcoin market, with the US stock spot Bitcoin ETF recording a net inflow of $167 million, while investments in Ethereum and others are continuously withdrawing. The current price of Bitcoin is approximately $71,000. Analysts believe that under the influence of the macro environment and geopolitical factors, institutions prefer Bitcoin. Long-term institutional holdings are still increasing, with future target prices possibly ranging from $110,000 to $170,000. On the technical side, $72,000 is an important resistance level, and a drop below $65,000 could trigger a correction.
GateNews15m ago
Crypto Prices Remain Flat While Asia Secures Natural Gas Supplies
Crypto prices remained flat, with BTC and ETH showing minor declines. Asia secured new natural gas supplies amid conflict fears. In US stock indexes, Nasdaq rose slightly while Dow and S&P 500 fell, reflecting mixed market reactions.
TheNewsCrypto18m ago
Bitcoin drops below $70,000: Iran conflict and US CPI ahead trigger risk aversion, market closely watches the $80,000 key level
Bitcoin price drops below $70,000 again due to geopolitical risks and market caution. Trump's warning to Iran has increased market uncertainty, and high oil prices are affecting investor confidence, despite institutional continued buying of Bitcoin. Market sentiment remains cautious, with investors paying attention to U.S. CPI data and the progress of the CLARITY Act.
GateNews26m ago