**Date: **Sat, Jan 03, 2026 | 04:25 PM GMT
As 2026 kicks off, the broader cryptocurrency market is showing renewed stability. Ethereum (ETH) has reclaimed the $3,100 level, and momentum is gradually rotating into select altcoins — including World Liberty Financial (WLFI).
WLFI has jumped nearly 9% on the day, extending its weekly gains to around 16%, but the more important development is unfolding on the chart. On lower timeframes, price action is forming a well-defined bullish structure, suggesting that the token may be gearing up for a meaningful breakout if key levels are reclaimed.
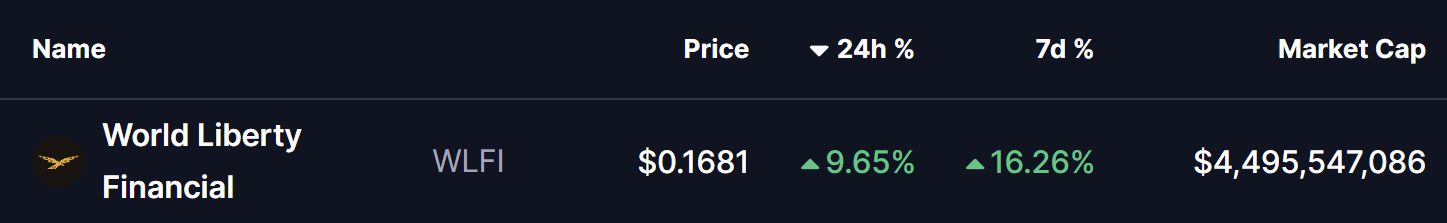
Source: Coinmarketcap
Ascending Triangle In Play
On the 4-hour chart, WLFI is forming a clear ascending triangle, characterized by a series of higher lows pushing steadily into a flat resistance zone. This pattern is widely viewed as a bullish continuation setup, especially when it develops during a prolonged consolidation phase accompanied by consistent dip-buying.
WLFI recently faced rejection near the $0.1741 resistance zone, which capped multiple upside attempts. That rejection pushed price back toward the rising support trendline, with buyers stepping in around the $0.1222 region. Importantly, each pullback has been shallower than the last, reinforcing the presence of strong underlying demand.
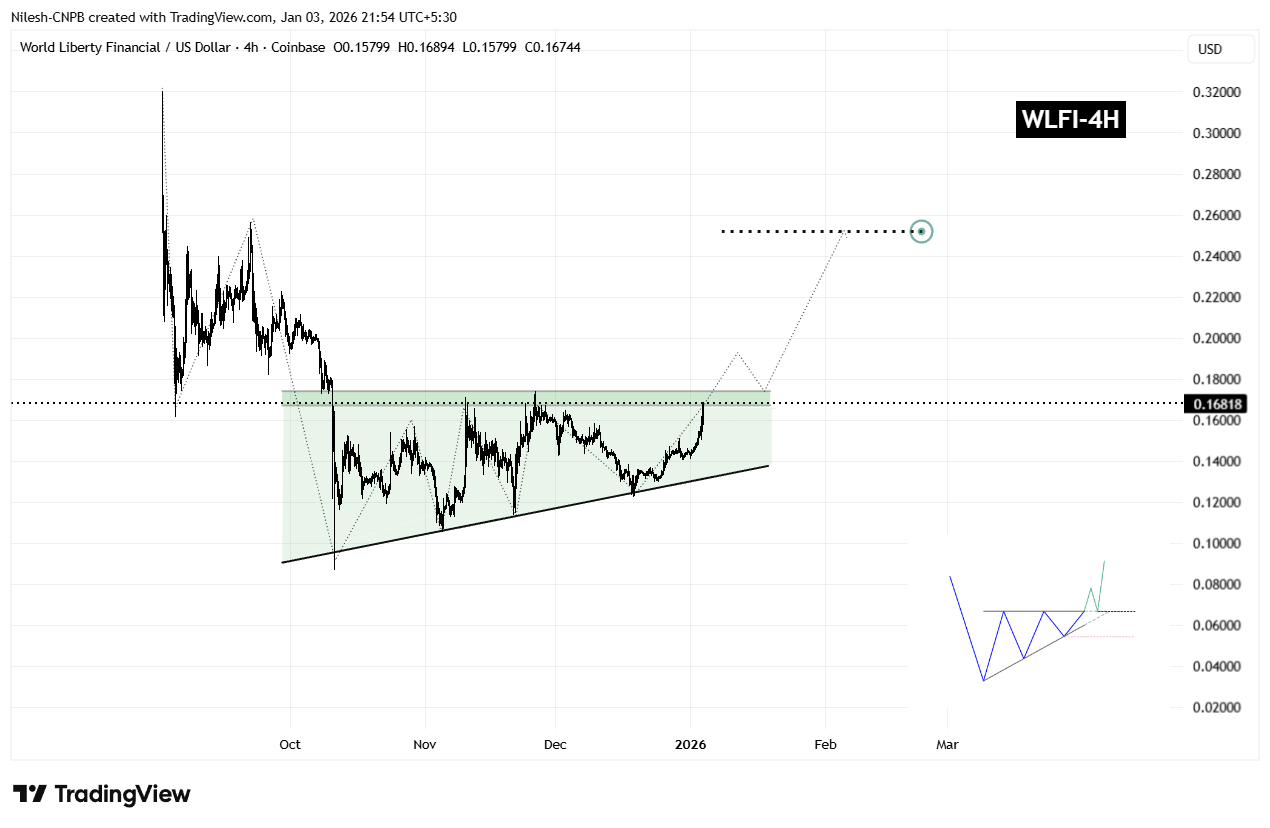
WLFI 4H Chart/Coinsprobe (Source: Tradingview)
The latest rebound has once again carried WLFI toward the upper boundary of the triangle, reinforcing the idea that demand remains firm. Rather than signaling weakness, this sideways-to-higher price action reflects healthy consolidation as volatility tightens ahead of a potential breakout.
What’s Next for WLFI?
From here, WLFI appears poised for another test of the $0.1741 resistance. A decisive breakout above this level, followed by a sustained close and a successful retest as support, would confirm the ascending triangle pattern and likely trigger a broader bullish expansion phase.
Based on the measured move of the formation, the technical upside projection points toward the $0.2522 region. This target represents a potential upside of roughly 48% from current levels and also aligns with prior price structure, strengthening the bullish case.
That said, caution remains warranted. If WLFI fails to break above resistance, price could once again rotate back toward the rising support trendline. As long as this trendline continues to hold, the broader bullish structure remains intact. A decisive breakdown below ascending support, however, would invalidate the pattern and delay any breakout scenario.
For now, the combination of improving market sentiment, steady accumulation, and a tightening ascending triangle suggests that WLFI is approaching a critical inflection point — one that could define its next major move as the new year unfolds.
Disclaimer: The views and analysis presented in this article are for informational purposes only and reflect the author’s perspective, not financial advice. Technical patterns and indicators discussed are subject to market volatility and may or may not yield the anticipated results. Investors are advised to exercise caution, conduct independent research, and make decisions aligned with their individual risk tolerance.
About Author: Nilesh Hembade is the Founder and Lead Author of Coinsprobe, with over 5 years of experience in the cryptocurrency and blockchain industry. Since launching Coinsprobe in 2023, he has been providing daily, research-driven insights through in-depth market analysis, on-chain data, and technical research.
Disclaimer: The information on this page may come from third parties and does not represent the views or opinions of Gate. The content displayed on this page is for reference only and does not constitute any financial, investment, or legal advice. Gate does not guarantee the accuracy or completeness of the information and shall not be liable for any losses arising from the use of this information. Virtual asset investments carry high risks and are subject to significant price volatility. You may lose all of your invested principal. Please fully understand the relevant risks and make prudent decisions based on your own financial situation and risk tolerance. For details, please refer to
Disclaimer.
Related Articles
鏈上熱到爆、以太幣卻漲不動?專家揭「致命死穴」:恐下探 1,500 美元
CryptoQuant 報告指出,以太坊面臨「採用悖論」,雖然網路活躍度創新高,但幣價卻下滑。若熊市持續,到第三季末以太幣可能跌至 1,500 美元。智能合約活躍度上升與以太幣價格脫鉤,交易所流入量更能反映價格動態。投資需求疲軟,資金持續流失是主要隱憂。
区块客Just Now
Dogecoin (DOGE) phát tín hiệu khởi sắc khi dòng tiền nhà đầu tư cá nhân quay lại
Dogecoin (DOGE) is experiencing a recovery, currently up over 2% and nearing the psychological $0.1000 mark. Increased speculative activity is attracting traders to the derivatives market, and technical indicators suggest a cautious positive outlook for DOGE.
TapChiBitcoin11m ago
DePIN and AI Lead the Charge – Analyzing the Top Weekly Crypto Gainers
The cryptocurrency market serves as an indicator for new technological trends, and weekly data for the cryptocurrency market collected by CoinMarketCap show that investor sentiment has recently changed a lot. The market remains directionless overall, yet an exclusive set of projects, particularly in
BlockChainReporter11m ago
Liệu RAVE có sẵn sàng tăng 30% sau khi lấy lại được mức hỗ trợ này?
RaveDAO (RAVE) hiện đang giao dịch ở mức $0,2475 sau khi ghi nhận mức tăng ấn tượng 16,45%. Đáng chú ý, sự gia tăng mạnh mẽ trong hoạt động thị trường đã được ghi nhận, với khối lượng giao dịch tăng vọt 125%, đạt $88,15 triệu. Điều này phản ánh sự quan tâm lớn từ các nhà đầu tư và nhà giao dịch đối
TapChiBitcoin1h ago
+112 Billion Shiba Inu (SHIB) in 24 Hours Returns Notorious 80 Trillion Threshold - U.Today
Shiba Inu finally recovering
Shiba Inu are ready to sell
More than 112 billion SHIB tokens were transferred to exchanges in the past day, bringing total exchange reserves back above the 80 trillion SHIB threshold, indicating a discernible change in Shiba Inu's on-chain dynamics.
Shiba Inu final
UToday1h ago
Solana Tests $90 Resistance as Fibonacci Confluence Signals Key Turning Point
Key Insights
Solana price is nearing a major resistance near $90 where Fibonacci retracement and value area levels align, creating a decisive technical barrier.
Market structure shows the rally forming part of an ABC corrective pattern, keeping the broader consolidation intact while price tr
CryptoFrontNews1h ago