
**Date: **Sat, Jan 03, 2026 | 01:26 PM GMT
As 2026 kicks off, the broader cryptocurrency market is showing renewed stability. Ethereum (ETH) has reclaimed the $3,100 level, and several major altcoins are already beginning to pick up momentum. Against this improving backdrop, Kaspa (KAS) is quietly positioning itself as a potential late mover, with its chart structure starting to flash early bullish signals.
While KAS is trading slightly in the red today and remains mostly flat on the weekly timeframe, the more important story is unfolding beneath the surface. Recent price action suggests a meaningful structural shift may be underway — one that could mark the early stages of a bullish continuation if confirmed.

Source: Coinmarketcap
Rounding Bottom in Play
On the 4-hour timeframe, Kaspa appears to be forming a rounding bottom pattern, a classic bullish reversal structure that typically develops after a prolonged corrective phase. This pattern reflects a slow but steady transition from distribution to accumulation, as selling pressure weakens and buyers gradually regain control.
The setup began after KAS faced strong rejection near the $0.06310 neckline zone, which triggered a sharp decline through late November and December. That downside move eventually found strong demand near the $0.040 level, which has since acted as a key support area. Multiple defenses of this zone prevented further downside and helped establish a stable base for a potential trend reversal.
Since carving out that bottom, KAS has started to curve higher in a smooth, rounded fashion — closely matching the textbook structure of a developing rounding bottom. The recent stabilization above the $0.045 region further supports the idea that downside momentum is fading.
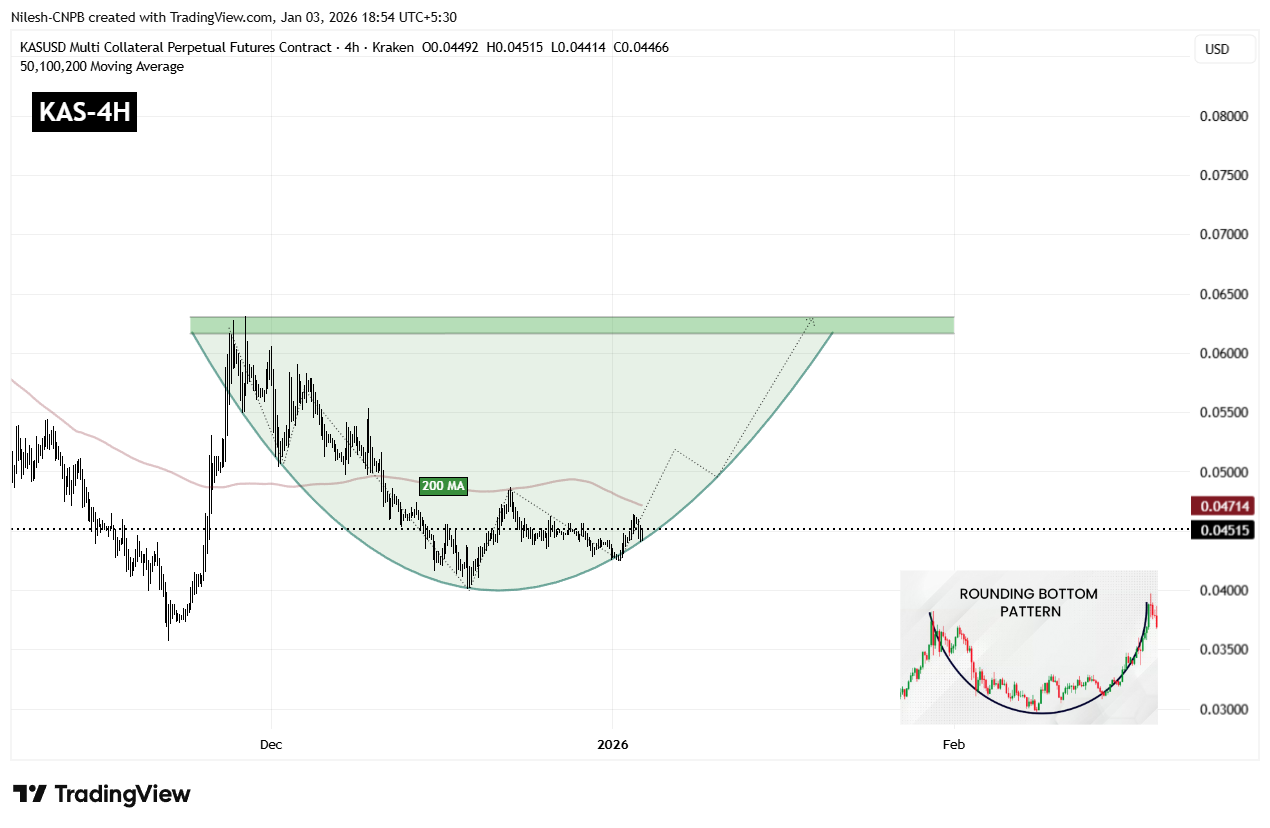
Kaspa (KAS) 4H Chart/Coinsprobe (Source: Tradingview)
A key technical level now comes into focus: the 200-period moving average, currently hovering near $0.04714. This level has acted as dynamic resistance during the recovery phase, and reclaiming it would mark an important shift in short-term market structure.
A sustained move above the 200 MA would indicate that buyers are regaining control after months of corrective price action and could act as the trigger for a stronger upside continuation.
What’s Next for KAS?
For full confirmation of the rounding bottom pattern, KAS must eventually reclaim the $0.06310 neckline resistance. A clean breakout above this zone would validate the entire reversal structure and could open the door to a broader bullish expansion phase, with momentum traders likely re-entering the market.
Until that breakout occurs, the pattern remains in development. Short-term consolidation or shallow pullbacks remain possible, especially near moving average resistance. However, as long as price continues to hold above the $0.04245 support base and maintains higher lows, the broader bottoming structure remains intact and constructive.
In the near term, all eyes remain on the 200 MA and the neckline zone. How Kaspa reacts around these levels will likely determine whether this emerging bullish setup evolves into a confirmed breakout move or requires more time to mature.
Disclaimer: The views and analysis presented in this article are for informational purposes only and reflect the author’s perspective, not financial advice. Technical patterns and indicators discussed are subject to market volatility and may or may not yield the anticipated results. Investors are advised to exercise caution, conduct independent research, and make decisions aligned with their individual risk tolerance.
About Author: Nilesh Hembade is the Founder and Lead Author of Coinsprobe, with over 5 years of experience in the cryptocurrency and blockchain industry. Since launching Coinsprobe in 2023, he has been providing daily, research-driven insights through in-depth market analysis, on-chain data, and technical research.
Disclaimer: The information on this page may come from third parties and does not represent the views or opinions of Gate. The content displayed on this page is for reference only and does not constitute any financial, investment, or legal advice. Gate does not guarantee the accuracy or completeness of the information and shall not be liable for any losses arising from the use of this information. Virtual asset investments carry high risks and are subject to significant price volatility. You may lose all of your invested principal. Please fully understand the relevant risks and make prudent decisions based on your own financial situation and risk tolerance. For details, please refer to
Disclaimer.
Related Articles
Bitcoin rebounds to $70,800, oil prices decline supports market but upward momentum diverges
On March 20, Bitcoin rebounded to $70,800, with gains exceeding 1%, after multiple countries pledged to ensure freedom of navigation through the Strait of Hormuz. Energy market shifts drove oil prices lower, but uncertainty from Middle East conflicts created bearish signals in traditional markets affecting crypto assets. Bitcoin's near-term trajectory remains dominated by macroeconomic factors, with $70,000 as a key level to watch.
GateNews5m ago
Solana DApps Fall to 18-Month Low, SOL Faces Risk of Retesting 80 Dollar Level
Solana ecosystem DApps revenue has dropped to $22 million, marking an 18-month low, while the derivatives market is also showing bearish signals with funding rates near 0% and option skew surging, reflecting institutional lack of confidence in the future. The rise of competitor Hyperliquid has further intensified the pressure, leading to erosion of Solana's market share in the derivatives sector.
MarketWhisper9m ago
The Federal Reserve's hawkish stance suppresses risk appetite, putting Bitcoin's price pressure below the $70,000 level.
On March 20, the Federal Reserve maintained interest rates unchanged, and Bitcoin's price quickly retreated to around $70,000, with a decline approaching 5%. Market risk appetite cooled, with Ethereum, Dogecoin, and others also coming under pressure, demonstrating the impact of macroeconomic factors on the crypto market. Analysts pointed out that Bitcoin trading will depend on selective capital flows, and elevated interest rates combined with geopolitical risks may cause it to maintain a volatile and weak pattern in the short term.
GateNews10m ago
Bitcoin dips back below $75,000 on the eve of the Federal Reserve decision
Bitcoin recently touched $75,000 but failed to sustain the level, pulling back to $74,000, reflecting cautious sentiment among investors ahead of the upcoming Federal Reserve interest rate decision. Geopolitical risks and elevated energy prices have driven inflation higher, affecting market expectations for rate cuts and pushing the timeline for cuts to year-end. Technical analysis shows Bitcoin remains strong but has not confirmed a decisive breakout above the $75,000 level, with limited upside potential in the near term.
区块客35m ago
Bitcoin ETF Ends Seven-Day Winning Streak, Bitcoin Price Pressure Returns
Recently, U.S. Bitcoin spot ETFs experienced significant outflows after consecutive seven trading days of net inflows, with net outflows of $163.5 million on the 18th and an additional $51.9 million flowing out on the 19th, indicating simultaneous weakening of both market capital and price. Bitcoin price briefly fell below $70,000, highlighting that ETF capital flows can no longer support its rebound, and the deteriorating macroeconomic environment is putting pressure on risk assets, causing investor preferences to contract significantly. The test of the $70,000 level has become a barometer of short-term market sentiment.
区块客39m ago
