
**Date: **Sun, Jan 04, 2026 | 01:14 PM GMT
As 2026 gets underway, the broader cryptocurrency market is showing renewed stability. Ethereum (ETH) is up nearly 6% on the week, and several major altcoins are beginning to regain momentum. Against this improving backdrop, Hyperliquid (HYPE) is quietly positioning itself as a potential late mover, with its chart structure starting to flash early bullish signals.
While HYPE remains mostly flat on the weekly timeframe, the more important story is unfolding beneath the surface. Recent price action suggests a meaningful structural shift may be underway — one that could mark the early stages of a bullish continuation if key levels are reclaimed.
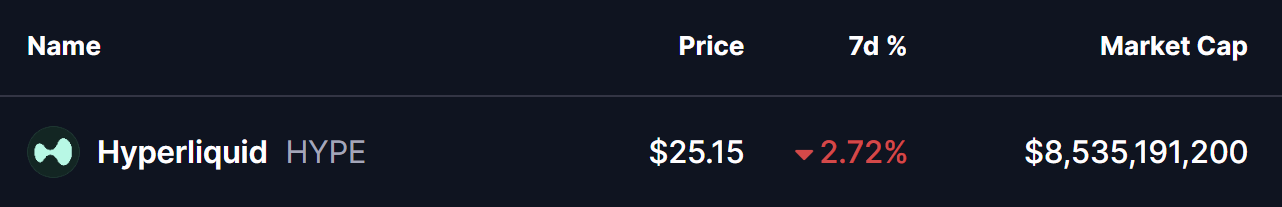
Source: Coinmarketcap
Rounding Bottom Pattern Taking Shape
On the daily timeframe, Hyperliquid appears to be forming a rounding bottom pattern, a classic bullish reversal structure that typically develops after a prolonged corrective phase. This pattern reflects a slow transition from aggressive selling to steady accumulation, as downside momentum fades and buyers gradually step back in.
The setup began after HYPE faced strong rejection near the $51.42–$50.06 neckline resistance zone, which triggered a sharp decline through late November and December. That downside move eventually found strong demand near the $22.20 support level, where selling pressure stalled. Multiple defenses of this area prevented further downside and helped establish a solid base for a potential trend reversal.
Since carving out that bottom, HYPE has started to curve higher in a smooth, rounded fashion — closely matching the textbook structure of a developing rounding bottom. The recent stabilization above the $25 region further supports the view that selling pressure is weakening and accumulation may be underway.
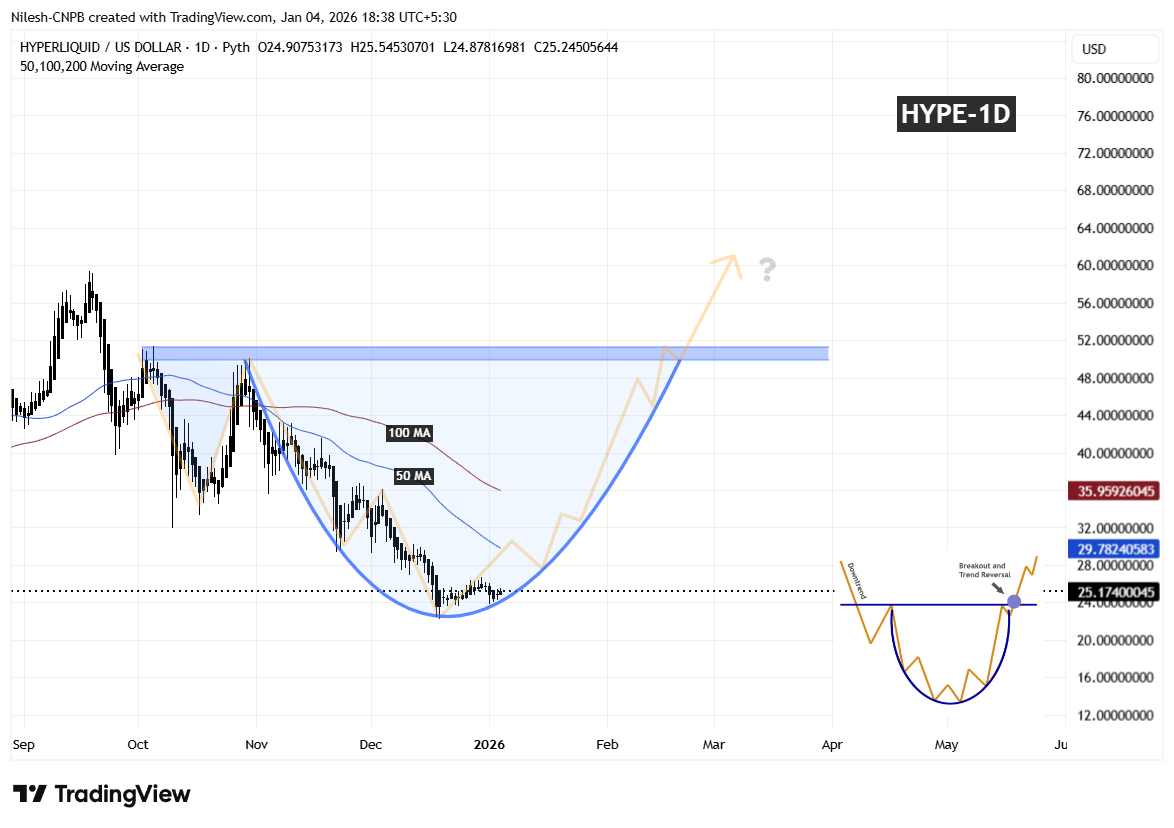
Hyperliquid (HYPE) Daily Chart/Coinsprobe (Source: Tradingview)
A key technical level now comes into play: the 50-day moving average, currently hovering near $29.78. This level has acted as dynamic resistance during the early recovery phase, and reclaiming it would mark an important shift in short-term market structure.
What’s Next for HYPE?
A sustained reclaim of the 50-day MA would be the first meaningful confirmation that buyers are regaining control after months of corrective price action. Holding above this level could allow price to build momentum toward the 100-day MA, which would further reinforce the developing reversal structure.
Looking ahead, the most important level remains the $51.42–$50.06 neckline resistance zone. A clean breakout above this area would validate the entire rounding bottom pattern and could open the door to a broader bullish expansion phase, with momentum traders likely re-entering the market.
In the near term, all eyes remain on the 50-day MA reclaim for upside confirmation. Until that happens, short-term consolidation or shallow pullbacks remain possible. However, as long as price continues to hold above the established base, the broader bottoming structure remains intact and constructive.
Disclaimer: The views and analysis presented in this article are for informational purposes only and reflect the author’s perspective, not financial advice. Technical patterns and indicators discussed are subject to market volatility and may or may not yield the anticipated results. Investors are advised to exercise caution, conduct independent research, and make decisions aligned with their individual risk tolerance.
About Author: Nilesh Hembade is the Founder and Lead Author of Coinsprobe, with over 5 years of experience in the cryptocurrency and blockchain industry. Since launching Coinsprobe in 2023, he has been providing daily, research-driven insights through in-depth market analysis, on-chain data, and technical research.
Disclaimer: The information on this page may come from third parties and does not represent the views or opinions of Gate. The content displayed on this page is for reference only and does not constitute any financial, investment, or legal advice. Gate does not guarantee the accuracy or completeness of the information and shall not be liable for any losses arising from the use of this information. Virtual asset investments carry high risks and are subject to significant price volatility. You may lose all of your invested principal. Please fully understand the relevant risks and make prudent decisions based on your own financial situation and risk tolerance. For details, please refer to
Disclaimer.
Related Articles
Today, the cryptocurrency Fear and Greed Index rose to 18, and the market remains in extreme fear.
Gate News Report, March 12 — According to data from Alternative.me, the cryptocurrency Fear & Greed Index rose to 18 today, up from 15 yesterday, but market sentiment remains in a state of "Extreme Fear."
GateNews25m ago
Middle Eastern conflict pushes up oil prices, Bitcoin remains steady above 70,000
The Middle East situation and oil price fluctuations are affecting investor sentiment. U.S. crude oil prices have broken through $91, despite the IEA releasing 400 million barrels of oil. U.S. stocks are mixed, the dollar is rising, and cryptocurrencies have seen a slight rebound, with Bitcoin staying above $70,000. The SEC and CFTC have reached a cooperation agreement to promote cryptocurrency regulation and the development of emerging technologies.
ChainNewsAbmedia26m ago
Bitcoin Facing $75K Sell Wall Despite Whale and Institution Buy-Ins, Here’s Why - BTC Hunts
Bitcoin struggles to break the $75K resistance despite increased whale investments and institutional buy-ins. Current trading is at $70,525, influenced by market uncertainty related to global events and upcoming economic announcements.
BTCHUNTS38m ago
Bitcoin Holds $69K–$71K Range Amid Middle East Ceasefire Confusion
Bitcoin hovered in a narrow band between $69,000 and $71,000 as traders weighed mixed diplomatic signals over a possible Middle East ceasefire.
Divergent Signals From Washington
Bitcoin maintained a tight consolidation pattern between $69,000 and $71,000 Wednesday as market participants
Coinpedia5h ago
Dogecoin Tests $0.090 Support After 3.4% Drop as Traders Watch Key Price Range
Dogecoin is currently trading at $0.09061 which is a drop of 3.4 percent, and the price is close to the important level of $0.09011 support.
The chart indicates a series of tests of the support zone of $0.089-$0.090, and the closest resistance is represented by $0.09353.
A hold of
CryptoNewsLand5h ago
Tom Lee Predicts ETH ATH at $15,000 as Ethereum Activity Hits Record Levels
Tom Lee predicts ETH ATH at $15,000 and above.
Ethereum network usage activity hits record levels.
This is a bullish signal, a move unseen since 2021 bull run.
As the price of the pioneer crypto asset, Bitcoin (BTC), continues to try and reclaim prices above $70,000, the pioneer
CryptoNewsLand5h ago