Pepe (PEPE) is facing a strong sell-off wave as it records the fifth consecutive red session, declining about 1% at the time of observation on Saturday. The correction comes right after a 72% breakout last week, raising the possibility that the market is entering a short-term profit-taking phase. Meanwhile, on-chain data shows a decline in network activity on PEPE, reflecting a cooling of investor interest.
On the technical side, the 100-day exponential moving average (EMA) is emerging as an important support zone, playing a key role in determining the next trend of this memecoin.
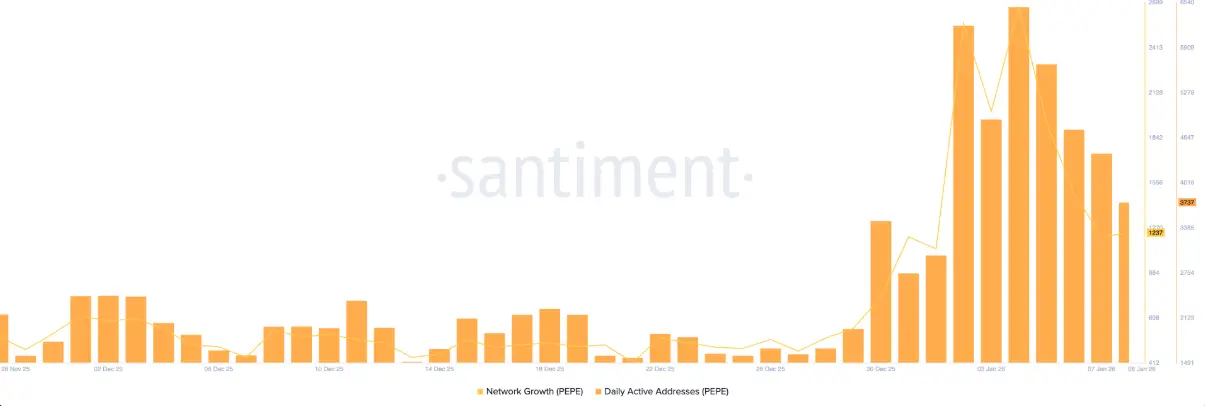
On-chain activity and retail investor interest decline
Pepe is showing clear signs of cooling this week as user interest decreases, reflecting a correction phase after the strong network activity breakout last week. According to data from Santiment, the network growth index – representing the number of new addresses participating – dropped sharply to 1,237 on Thursday, from a peak of 2,673 recorded on Sunday.
This weakening trend is also evident in the daily active addresses, which fell to 3,737, significantly lower than 6,476 in the previous period, indicating a slowdown in network engagement.
 The development of the PEPE network | Source: SantimentAdditionally, Pepe’s trading volume continues to plummet, reaching only 738.32 million PEPE on Thursday, far below the peak of 1.66 billion in January. This indicates a significant decline in liquidity and market participation. Notably, interest from retail investors has also faded, with Pepe’s social media presence dropping to 0.117%, down sharply from 0.282% on January 2, reflecting the cooling of this memecoin’s hype.
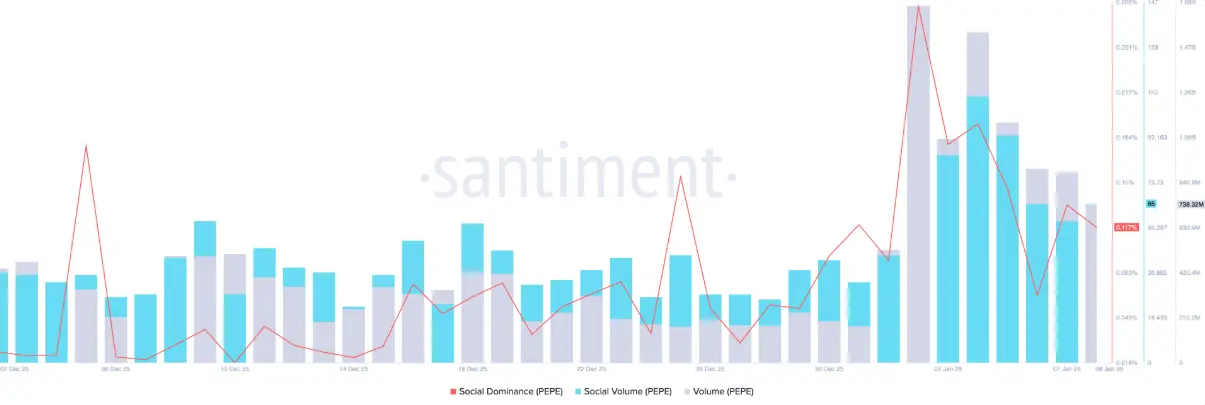 Social dominance of PEPE | Source: Santiment## Technical outlook: Can Pepe hold the 100-day EMA?
Pepe is currently testing the 100-day EMA around $0.00000598, after a roughly 15% correction from the peak of $0.00000726 set on Monday. If this frog-themed memecoin closes the day decisively below this important moving average, the downtrend is likely to continue, pushing the price back to the 50-day EMA at $0.00000519 – a zone close to the November 4 bottom at $0.00000521, thus reinforcing its key support role.
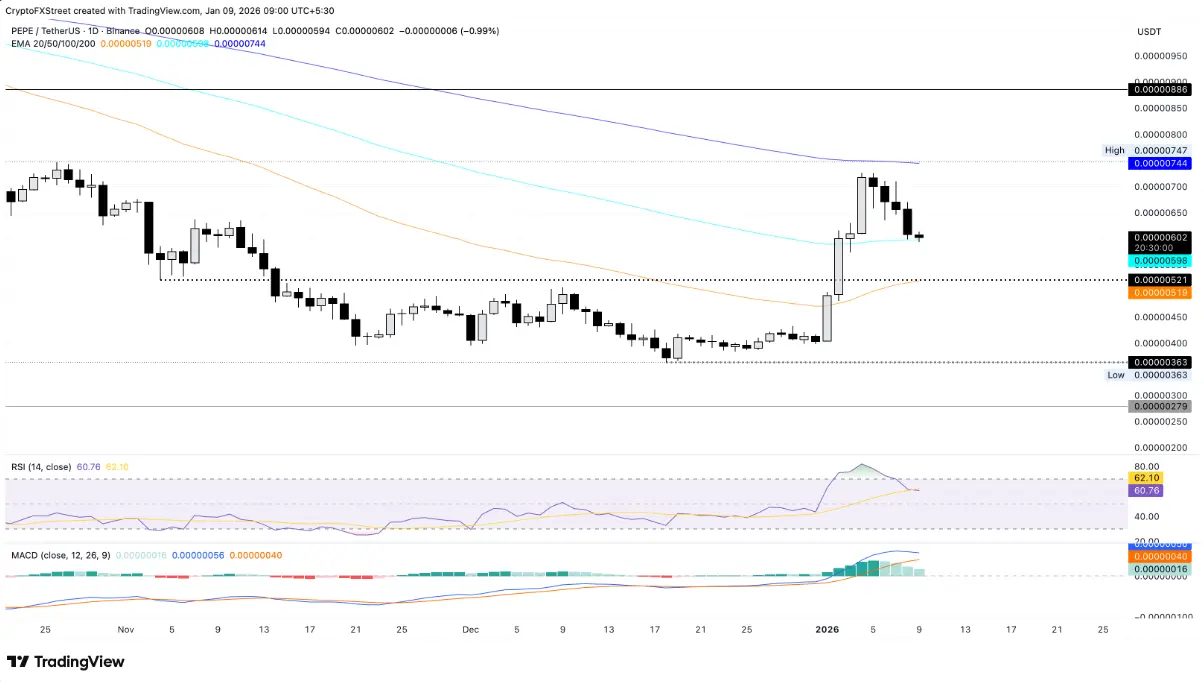 Daily PEPE/USDT chart | Source: TradingView Momentum indicators on the daily timeframe are clearly reflecting weakening buying strength in the current correction. The RSI has exited the overbought zone, falling around 60 and heading toward the neutral threshold. Meanwhile, the MACD line is approaching the signal line as green histogram bars shrink rapidly. A bearish crossover scenario, accompanied by red histograms below zero, could trigger a clearer sell signal.
In a positive scenario, if PEPE quickly regains its recovery momentum, the nearest target for the price would be the 200-day EMA at around $0.00000744.
Disclaimer: The information on this page may come from third parties and does not represent the views or opinions of Gate. The content displayed on this page is for reference only and does not constitute any financial, investment, or legal advice. Gate does not guarantee the accuracy or completeness of the information and shall not be liable for any losses arising from the use of this information. Virtual asset investments carry high risks and are subject to significant price volatility. You may lose all of your invested principal. Please fully understand the relevant risks and make prudent decisions based on your own financial situation and risk tolerance. For details, please refer to
Disclaimer.