
**Date: **Mon, Jan 05, 2026 | 07:04 AM GMT
As 2026 kicks off, the broader cryptocurrency market is showing renewed stability. Ethereum (ETH) is up around 4% on the week, and improving sentiment is gradually spreading across major altcoins — including the AI-focused blockchain token Near Protocol (NEAR).
NEAR has already gained more than 10% on a weekly basis, but the more important development is unfolding beneath the surface. Recent price action points to a notable structural shift — one that could mark the early stages of a bullish continuation if key resistance levels are reclaimed.
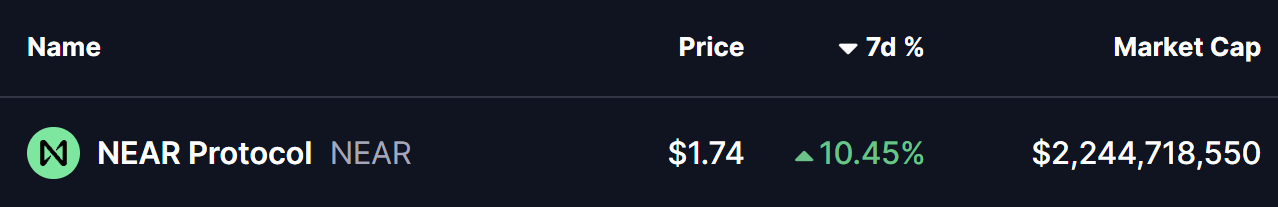
Source: Coinmarketcap
Rounding Bottom in Play
On the daily timeframe, NEAR appears to be forming a rounding bottom pattern, a classic bullish reversal structure that typically emerges after a prolonged corrective phase. This pattern reflects a gradual transition from distribution to accumulation, as selling pressure fades and buyers slowly regain control.
The setup began after NEAR faced a firm rejection near the $1.88 region late last month. That rejection triggered a sharp decline, dragging price down toward the $1.40 area. Importantly, sellers failed to push price meaningfully lower from there, and strong demand emerged at those levels. Over time, NEAR stabilized, volatility compressed, and price began to curl higher — completing the rounded base structure.
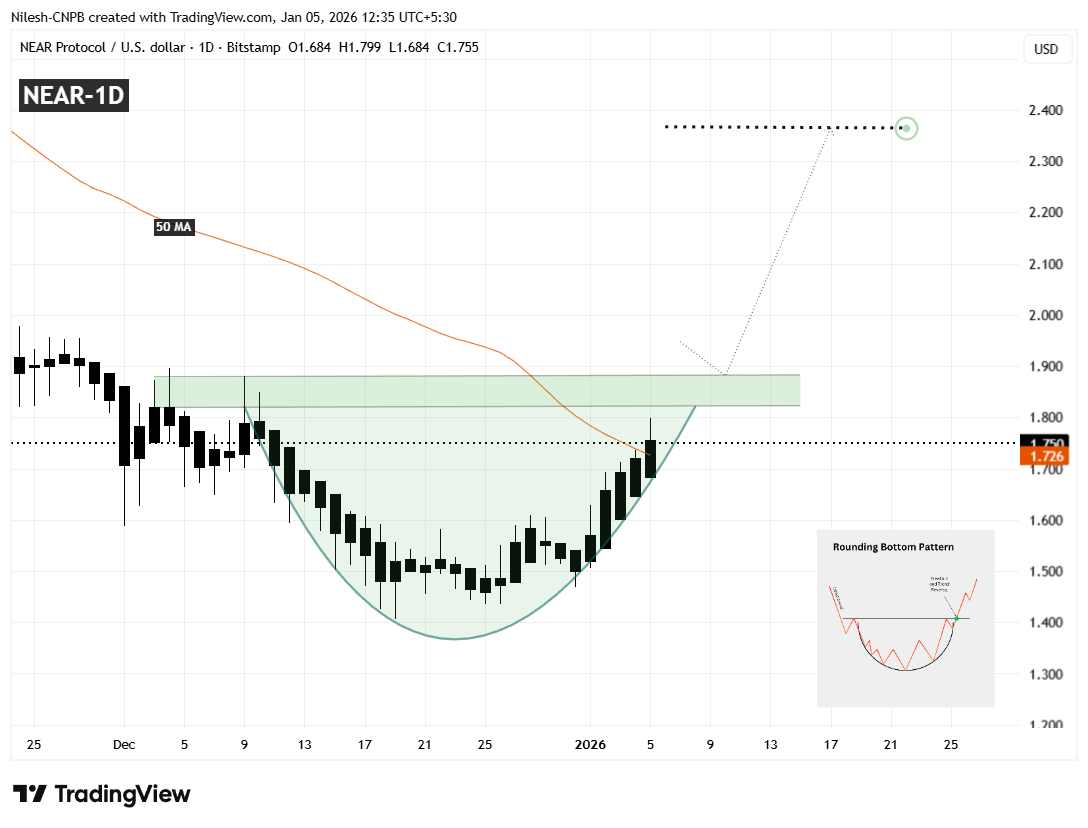
Near Protocol (NEAR) Daily Chart/Coinsprobe (Source: Tradingview)
After reclaiming the 50-day moving average near $1.726, NEAR has shown improving momentum. Currently, price is trading around the $1.75 level and pressing up against a well-defined resistance zone between $1.82 and $1.88. This area represents the neckline of the rounding bottom pattern and has capped upside attempts multiple times in the past, making it the most critical level to watch in the near term.
What’s Next for NEAR?
If NEAR continues to hold the 50-day moving average as support, a clean daily close above the $1.82–$1.88 resistance zone would confirm the bullish rounding bottom breakout. A successful breakout followed by a retest of this zone as support would significantly strengthen the bullish case and signal that a new upward leg is underway.
Based on the depth of the rounding structure, the projected upside target points toward the $2.36 region. Reaching that level would imply a potential upside of roughly 35% from current prices, aligning well with the measured move typically associated with this pattern.
That said, patience remains important. Before any confirmed breakout, NEAR could still experience short-term pullbacks — including a dip toward the rising base of the rounding structure, which has been acting as dynamic support during the recovery. Such pullbacks would not invalidate the bullish setup as long as price continues to hold above the higher-low structure.
Until a decisive breakout and follow-through occur, traders may want to remain cautious and avoid chasing price. The $1.82–$1.88 zone remains the line in the sand that will determine whether NEAR transitions into a sustained bullish phase or remains range-bound for longer.
Disclaimer: The views and analysis presented in this article are for informational purposes only and reflect the author’s perspective, not financial advice. Technical patterns and indicators discussed are subject to market volatility and may or may not yield the anticipated results. Investors are advised to exercise caution, conduct independent research, and make decisions aligned with their individual risk tolerance.
About Author: Nilesh Hembade is the Founder and Lead Author of Coinsprobe, with over 5 years of experience in the cryptocurrency and blockchain industry. Since launching Coinsprobe in 2023, he has been providing daily, research-driven insights through in-depth market analysis, on-chain data, and technical research.
Disclaimer: The information on this page may come from third parties and does not represent the views or opinions of Gate. The content displayed on this page is for reference only and does not constitute any financial, investment, or legal advice. Gate does not guarantee the accuracy or completeness of the information and shall not be liable for any losses arising from the use of this information. Virtual asset investments carry high risks and are subject to significant price volatility. You may lose all of your invested principal. Please fully understand the relevant risks and make prudent decisions based on your own financial situation and risk tolerance. For details, please refer to
Disclaimer.
Related Articles
Michael Saylor: Strategy - There is a time lag between buying Bitcoin and price appreciation
Gate News reports that on March 12, Strategy founder Michael Saylor posted: "There is a time lag between when we purchase Bitcoin and when the Bitcoin price skyrockets."
GateNews30m ago
Why OXT Just Skyrocketed 21.97% in 30 Minutes
OXT price surged 21.97%, now at $0.0211, driven by macroeconomic trends and increased trading activity. Analysts suggest the bullish sentiment in major cryptocurrencies boosts altcoin interest, while traders watch key resistance and support levels.
Coinfomania34m ago
BTC Rises 0.79% in 15 Minutes: On-Chain Large Capital Inflows and Favorable Macro Policies Drive Market Upswing
2026-03-12 15:15 to 2026-03-12 15:30 (UTC), BTC recorded a +k-line return of 0.79%, with price fluctuating between 69702.5 and 70428.9 USDT, reaching an amplitude of 1.04%. Trading activity was robust during this time window, with noticeably elevated market attention and intensified short-term volatility.
The primary driver of this price movement was on-chain large fund flows and increased institutional participation. During the same period, multiple large transfers exceeding 1,000 BTC flowed into exchange cold wallets, with whale addresses concentrating their buying activities. [Text appears to be incomplete]
GateNews38m ago
ETH 15-minute surge 0.94%: On-chain capital inflows and technical upgrade expectations resonate to drive gains
2026-03-12 15:15 to 2026-03-12 15:30 (UTC), ETH fluctuated within 1.15%, with price rising from 2047.22 USDT to 2070.72 USDT, achieving +0.94% gains. During the same period, market attention increased, trading volume expanded significantly, volatility enhanced compared to daily levels, and on-chain activity and capital flow data expanded synchronously, indicating concentrated efforts from bullish forces.
The main driving forces behind this price movement stem from concentrated on-chain capital inflows and technical upgrade expectations resonance. On-chain data shows that during the anomaly period ETH activity
GateNews38m ago
Bitcoin-to-Gold Ratio Shows Bullish Divergence, Bitcoin ETF Net Inflows of $906 Million Over the Past Month
On March 12, Bitcoin's ratio against gold displayed bullish divergence, indicating weakened selling pressure and potentially serving as a reference point for Bitcoin's long-term trend bottom. Bitcoin ETF net inflows reached approximately $906 million, while gold ETF experienced single-day outflows of $3 billion, forming a notable divergence. Despite ETF trading volume being lower than US equities, there remains significant room for institutional capital entry. Historically, Bitcoin has often rebounded following geopolitical turmoil.
GateNews40m ago
REQ Soars 21.77% — What Does This Mean for Traders?
Request Network (REQ) surged 21.77% within an hour, reaching $0.0839 amid growing trader interest. Market conditions, bullish sentiment, and DeFi trends may be driving this rally, while traders monitor key resistance and support levels for future movements.
Coinfomania1h ago