
**Date: **Wed, Jan 07, 2026 | 10:40 AM GMT
Key Takeaways:
-
Whale Activity: Three wallets linked to a single entity accumulated 3,000 BTC during this week’s price dip.
-
Technical Setup: BTC is forming an Ascending Triangle on the daily chart, a classic bullish continuation signal.
-
Key Levels: Support at $89,900 is the line in the sand; a breakout above $95,000 triggers the $108K target.
The broader cryptocurrency market is showing a mild pullback today after a strong start to the year. Bitcoin (BTC), which had rallied close to the $94,000 mark earlier this week, has cooled off and is now trading below $92,000, down around 1.89% on the day.
While short-term price action reflects some profit-taking, activity beneath the surface tells a different story. Large holders appear to be positioning for a bigger move, and the latest daily chart structure continues to hint at a potential upside resolution.
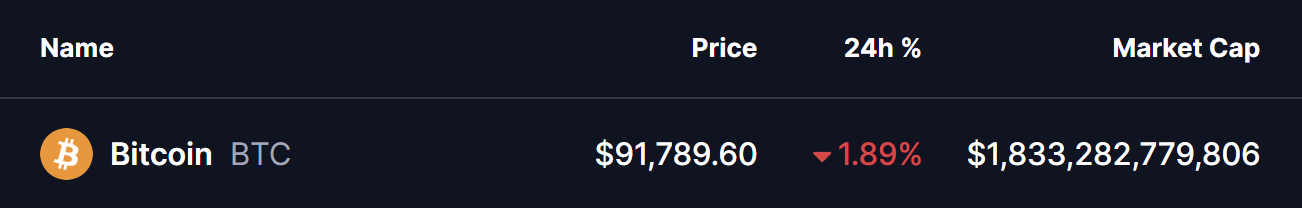
Source: Coinmarketcap
Is This Whale Buying a Sign of the Next BTC Breakout?
As Bitcoin gained momentum over the past several sessions, whales quietly stepped in with significant accumulation. According to data shared by Lookonchain, three wallets — potentially linked to the same entity — accumulated a combined 3,000 BTC worth roughly $280 million just hours ago.
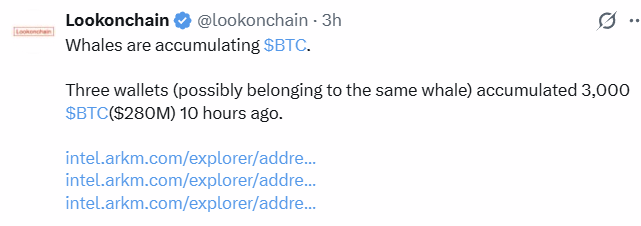
Source: Lookonchain (X)
This type of buying activity during a pullback often suggests long-term conviction rather than short-term speculation.
Ascending Triangle Taking Shape on the Daily Chart
On the daily timeframe, BTC appears to be forming an ascending triangle pattern — a structure commonly associated with bullish continuation when confirmed.
The pattern is defined by a rising trendline that has consistently supported higher lows since December, while price continues to face resistance in the $94,000–$95,000 zone. Each pullback has been increasingly shallow, signaling steady demand at higher price levels.
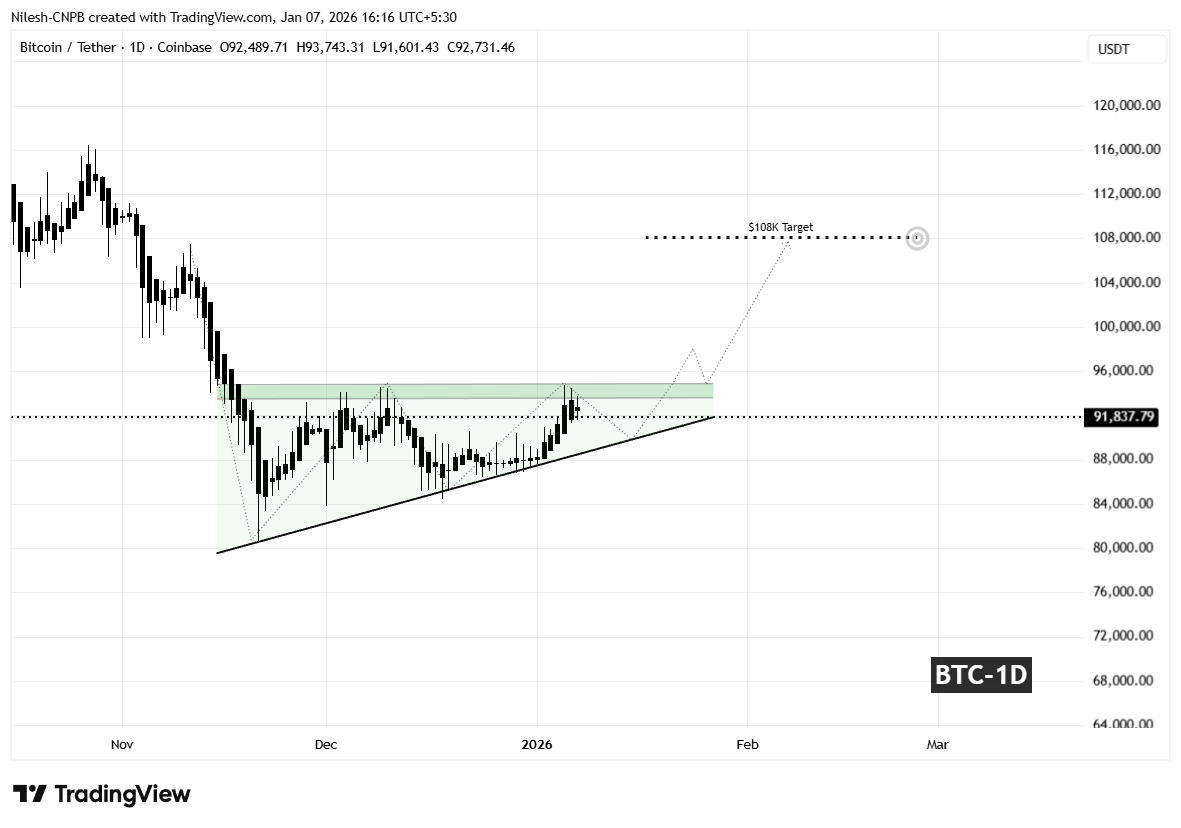
Bitcoin (BTC) Daily Chart/Coinsprobe (Source: Tradingview)
Today’s rejection from resistance pushed BTC back below $92,000, but price remains well above the ascending support trendline. A controlled pullback toward the $89,900–$90,000 area would still keep the broader structure intact and could serve as a healthy reset before the next attempt higher.
Will BTC Hit $108,000? The Scenario Outlook
The $89,000–$90,000 region now plays a crucial role in maintaining bullish structure. As long as BTC continues to hold above this rising trendline, the probability of another move toward the $94,000–$95,000 resistance zone remains elevated.
A decisive daily close above horizontal resistance would confirm an ascending triangle breakout and shift momentum firmly back in favor of the bulls. Such a move could also trigger fresh participation from sidelined buyers.
Based on the measured move projection of the triangle, a confirmed breakout points toward a potential upside target near $108,000 — matching the extension zone marked on the chart. From the breakout area, this would represent roughly a 14% upside move.
On the flip side, failure to hold the ascending support could invalidate the pattern and expose BTC to a deeper corrective move. Until either scenario is confirmed, price action within this structure remains a battle between patient accumulation and short-term selling pressure.
The Bottom Line: While Bitcoin (BTC) has dipped below $92,000, “Smart Money” is using the pullback to load up. On-chain data confirms that three major whales just accumulated $280 million in BTC. Technically, Bitcoin is coiled inside a massive Ascending Triangle, with a confirmed breakout targeting the $108,000 level.
Disclaimer: The views and analysis presented in this article are for informational purposes only and reflect the author’s perspective, not financial advice. Technical patterns and indicators discussed are subject to market volatility and may or may not yield the anticipated results. Investors are advised to exercise caution, conduct independent research, and make decisions aligned with their individual risk tolerance.
About Author: Nilesh Hembade is the Founder and Lead Author of Coinsprobe, with over 5 years of experience in the cryptocurrency and blockchain industry. Since launching Coinsprobe in 2023, he has been providing daily, research-driven insights through in-depth market analysis, on-chain data, and technical research.
Disclaimer: The information on this page may come from third parties and does not represent the views or opinions of Gate. The content displayed on this page is for reference only and does not constitute any financial, investment, or legal advice. Gate does not guarantee the accuracy or completeness of the information and shall not be liable for any losses arising from the use of this information. Virtual asset investments carry high risks and are subject to significant price volatility. You may lose all of your invested principal. Please fully understand the relevant risks and make prudent decisions based on your own financial situation and risk tolerance. For details, please refer to
Disclaimer.
Related Articles
Goldman Sachs warns: US stocks have "extreme rebound" momentum, with hedge short positions triggering short covering rally
Goldman Sachs pointed out that hedge funds are currently maintaining long positions in U.S. stocks while building large short positions through ETFs and index futures, creating potential short covering momentum. If positive news emerges, the market could rebound quickly. However, at the same time, reduced market liquidity and high uncertainty could also intensify volatility.
ChainNewsAbmedia2m ago
XRP Today News: XRPL 2.7 million transactions hit a new high, token price diverges from "decoupling"
XRP ledger's daily trading volume reaches 2.7 million transactions, but the XRP token price remains steady at around $1.37, indicating that increased on-chain activity has not led to new capital inflows. Analysis shows that internal transfers within institutions and automated trading account for a high proportion, failing to create strong buying demand. Breaking through $1.61 is the key to future upward momentum, while the long-term target of $100 requires multiple conditions to align, including widespread institutional adoption and an improved market environment.
MarketWhisper13m ago
Cardano Price Near Key Pivot as Macro Liquidity Signals Shift
Key Insights
Analyst Dan Gambardello links Cardano’s monthly RSI reset and macro liquidity cycles to conditions that previously preceded ADA’s explosive 2020–2021 rally.
ADA trades near $0.26 while the $0.288 moving average forms resistance, and the $0.24 to $0.25 zone continues acting as
CryptoFrontNews35m ago
The United States releases 172 million barrels of strategic oil! Iran warns oil prices could rise to $200
The U.S. Secretary of Energy announced plans to coordinate the release of 400 million barrels of oil to counter Iran's threats, with the release of 172 million barrels being the largest in history. Market reactions to this move are uncertain, and oil prices remain affected by the security situation in the Strait of Hormuz. At the same time, oil price fluctuations will impact the Bitcoin market, potentially increasing inflationary pressures and limiting liquidity. The United States plans to replenish the released oil within a year, which should not have a long-term impact on energy security.
MarketWhisper43m ago
Crude oil and gold volatility indices hit new highs in 2021, with bullish sentiment dominating the crypto options market.
On March 12th, Gate Research Institute noted that the volatility of traditional assets such as gold and crude oil reached new highs, at 33% and 108% respectively. In the crypto assets sector, the implied volatility of BTC and ETH is also high. Recently, the market has been dominated by put options, but the demand for hedging has weakened, and short-term price fluctuations may be influenced by Gamma effects. Gate has also launched gold and crude oil options, marking the first introduction of traditional assets.
GateNews47m ago
21Shares Analyst: BTC May Fluctuate Between $68,000 and $74,000 in the Short Term
21Shares strategist Matt Mena pointed out that March CPI data has been absorbed by the market. In the short term, BTC is expected to fluctuate between $68,000 and $74,000. After breaking above $75,000, it may enter the $75,000 to $80,000 range. Historically, BTC often rebounds more than 15% after geopolitical shocks, and a restart of rate cuts could accelerate the recovery.
GateNews1h ago