
**Date: **Sat, Jan 03, 2026 | 04:25 PM GMT
As 2026 kicks off, the broader cryptocurrency market is showing renewed stability. Ethereum (ETH) has reclaimed the $3,100 level, and momentum is gradually rotating into select altcoins — including World Liberty Financial (WLFI).
WLFI has jumped nearly 9% on the day, extending its weekly gains to around 16%, but the more important development is unfolding on the chart. On lower timeframes, price action is forming a well-defined bullish structure, suggesting that the token may be gearing up for a meaningful breakout if key levels are reclaimed.
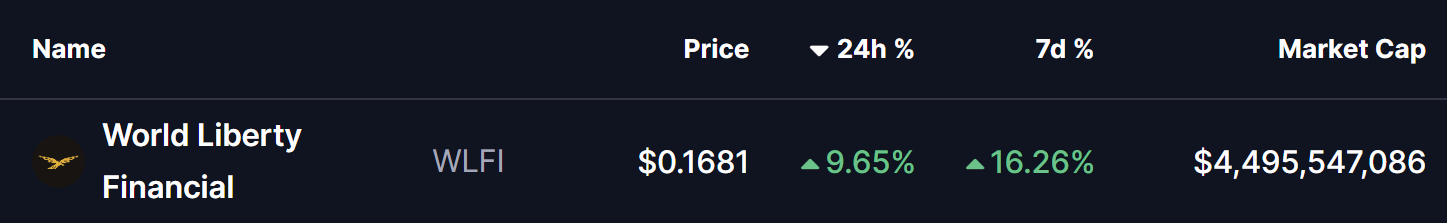
Source: Coinmarketcap
Ascending Triangle In Play
On the 4-hour chart, WLFI is forming a clear ascending triangle, characterized by a series of higher lows pushing steadily into a flat resistance zone. This pattern is widely viewed as a bullish continuation setup, especially when it develops during a prolonged consolidation phase accompanied by consistent dip-buying.
WLFI recently faced rejection near the $0.1741 resistance zone, which capped multiple upside attempts. That rejection pushed price back toward the rising support trendline, with buyers stepping in around the $0.1222 region. Importantly, each pullback has been shallower than the last, reinforcing the presence of strong underlying demand.
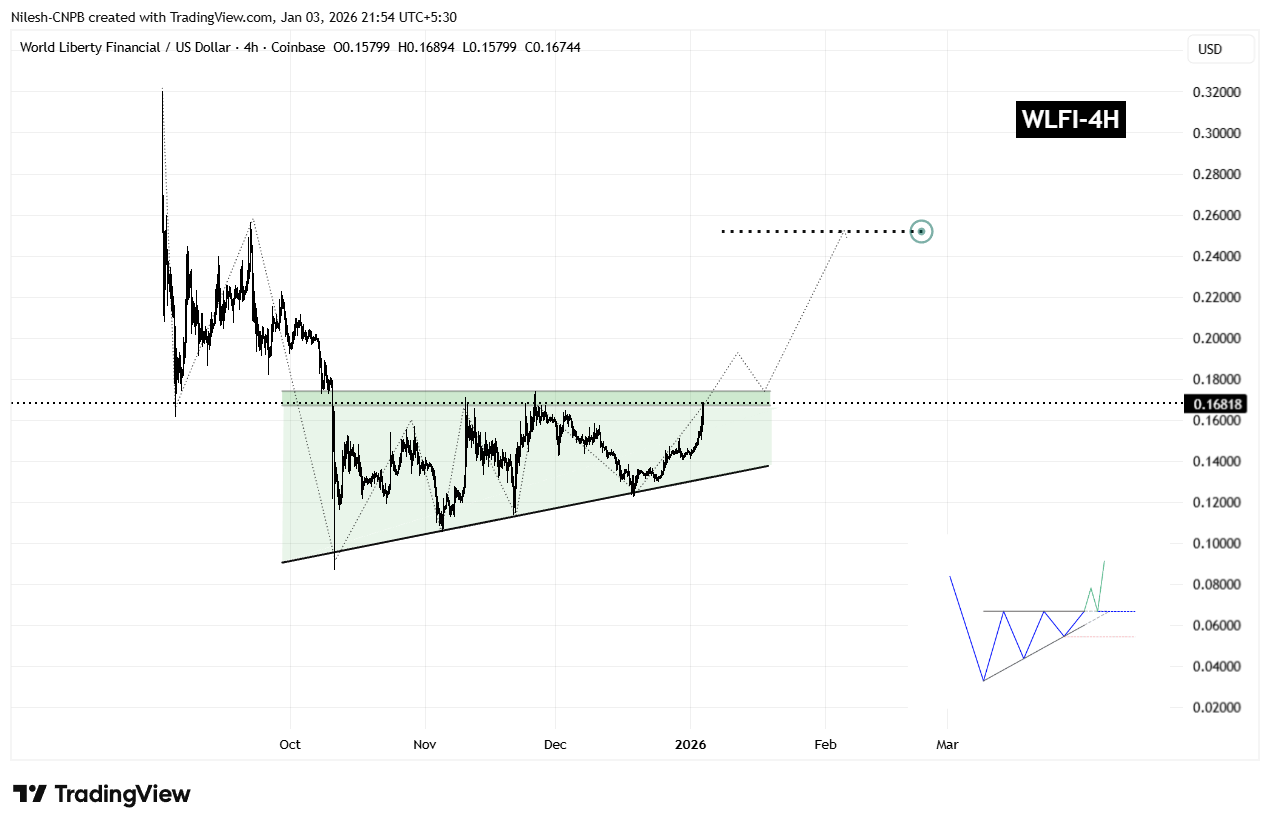
WLFI 4H Chart/Coinsprobe (Source: Tradingview)
The latest rebound has once again carried WLFI toward the upper boundary of the triangle, reinforcing the idea that demand remains firm. Rather than signaling weakness, this sideways-to-higher price action reflects healthy consolidation as volatility tightens ahead of a potential breakout.
What’s Next for WLFI?
From here, WLFI appears poised for another test of the $0.1741 resistance. A decisive breakout above this level, followed by a sustained close and a successful retest as support, would confirm the ascending triangle pattern and likely trigger a broader bullish expansion phase.
Based on the measured move of the formation, the technical upside projection points toward the $0.2522 region. This target represents a potential upside of roughly 48% from current levels and also aligns with prior price structure, strengthening the bullish case.
That said, caution remains warranted. If WLFI fails to break above resistance, price could once again rotate back toward the rising support trendline. As long as this trendline continues to hold, the broader bullish structure remains intact. A decisive breakdown below ascending support, however, would invalidate the pattern and delay any breakout scenario.
For now, the combination of improving market sentiment, steady accumulation, and a tightening ascending triangle suggests that WLFI is approaching a critical inflection point — one that could define its next major move as the new year unfolds.
Disclaimer: The views and analysis presented in this article are for informational purposes only and reflect the author’s perspective, not financial advice. Technical patterns and indicators discussed are subject to market volatility and may or may not yield the anticipated results. Investors are advised to exercise caution, conduct independent research, and make decisions aligned with their individual risk tolerance.
About Author: Nilesh Hembade is the Founder and Lead Author of Coinsprobe, with over 5 years of experience in the cryptocurrency and blockchain industry. Since launching Coinsprobe in 2023, he has been providing daily, research-driven insights through in-depth market analysis, on-chain data, and technical research.
Disclaimer: The information on this page may come from third parties and does not represent the views or opinions of Gate. The content displayed on this page is for reference only and does not constitute any financial, investment, or legal advice. Gate does not guarantee the accuracy or completeness of the information and shall not be liable for any losses arising from the use of this information. Virtual asset investments carry high risks and are subject to significant price volatility. You may lose all of your invested principal. Please fully understand the relevant risks and make prudent decisions based on your own financial situation and risk tolerance. For details, please refer to
Disclaimer.
Related Articles
Miners are no longer mining Bitcoin; they are selling electricity to AI.
Written by: Cathy, Plain Language Blockchain
Mining one Bitcoin costs $87,000. When sold, the market only pays you $67,000.
For each Bitcoin mined, you net a loss of $20,000. It’s not just losing on fees or electricity fluctuations; it’s a solid loss—losing $20,000 for every Bitcoin produced. This is the reality in March 2026. Data from Glassnode and MacroMicro both point to the same conclusion: Bitcoin mining, at current prices, is a losing business.
But miners aren’t just sitting around waiting to die. They’ve made a choice that the entire market didn’t expect—they’re stopping mining and selling electricity to AI.
Specifically, it’s not “stopping mining,” but rather emptying the Bitcoin treasury and pouring all funds into AI data centers, relegating mining to a side gig.
Since Bitcoin dropped from 126,000 in October 2025
PANews22m ago
Aptos unlocks $10.88 million worth of APT, but 69% of the supply is currently staked – which side will have the advantage?
After approving the proposal to limit the maximum supply of Aptos (APT) five days ago, this altcoin is now preparing for a new token unlock – a factor that could add volatility to the market.
Although APT has experienced a slight increase of about 1% in the past 24 hours, the long-term outlook appears less positive as volume
TapChiBitcoin32m ago
Trump says Iran war is almost over, BTC needs to hold $70,000. What do technicals say?
U.S. President Trump stated on March 10th that the Iran war is "almost over," leading to a cooling of geopolitical risk sentiment and driving cryptocurrencies like BTC to reverse and break above $70,000. Market expectations for the end date of the war have significantly increased, and risk assets are generally rising. Reflecting on the airstrike on February 28th, the market had wiped out $12.8 billion, and most indicators remain neutral with a key resistance at $74,000. Noticing that oil prices have fallen below $100, which may further support risk assets. Today's U.S. CPI data will influence market sentiment.
動區BlockTempo55m ago
Bitcoin faces short-term pressure approaching $70,000 ahead of US CPI data release
On March 11, Bitcoin price dropped over 2% due to market cautiousness. Economists expect US CPI data to be slightly higher than last month, although this data does not reflect the impact of rising oil prices, and Bitcoin's short-term response may remain stable. Tensions in the Middle East could lead to increased safe-haven demand. The market should pay attention to changes in key support and resistance levels to prepare for potential volatility.
GateNews1h ago
Arthur Hayes warns: Bitcoin may dip below $60,000 in the short term, but still has the potential to reach $500,000 in the long term
Cryptocurrency industry executive Arthur Hayes warns that Bitcoin may experience a short-term pullback to $60,000, but remains optimistic about its long-term potential, expecting the price to reach $500,000 to $750,000 by the end of 2026. He emphasizes that geopolitical tensions and high interest rates will influence BTC's movement, and investors should be cautious in responding to short-term fluctuations.
GateNews1h ago
Ethereum Price News: Network Activity Hits Record High, Why Is ETH Price Still Under Pressure?
Ethereum network activity hits a record high, but prices have not kept pace, with daily active addresses approaching 2 million. Capital flow has become the main driving force, with inflows to trading platforms surpassing Bitcoin. Although ETH accounts for 52% of stablecoin supply, the market remains focused on capital movement. It is expected that by 2026, ETH prices could rebound to $3,000.
GateNews1h ago