Bitcoin today fell 1.7% to $90,954, with 24-hour trading volume contracting 5.2% to $46.9 billion. Ethereum plummeted 3.3% to $3,137, and the total market capitalization of cryptocurrencies declined 1% to $3.12 trillion. Technical indicators show that the $94,100 level forms a triple top resistance, holding above the critical support at $90,900. A break below could test $86,970.
Triple Top Resistance Becomes the Last Straw for Bulls
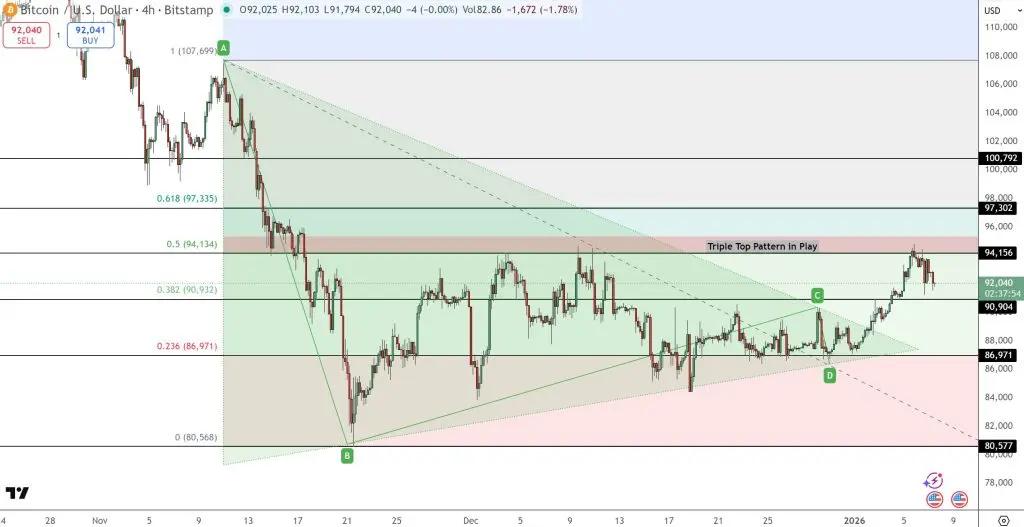
(Source: Trading View)
The primary reason for Bitcoin’s decline today is the failure of the triple top resistance on the technical chart. On the 4-hour chart, Bitcoin’s price consolidates around $92,000, within a descending channel starting from the high of $107,700. The price continues to hold above the 38.2% Fibonacci retracement at $90,900, while repeated resistance near $94,100 forms a clear triple top resistance zone.
A triple top is a classic bearish reversal pattern. When the price fails to break through the same resistance three times, it indicates strong selling pressure at that level and exhausted bullish momentum. Bitcoin’s three attempts near $94,100 all ended in failure, prompting technical traders to doubt whether the upward momentum has vanished. Once this doubt spreads, profit-taking and stop-loss sell orders will surge.
K-line patterns also support this view. Recent trading days show longer upper shadows, spinning tops, and small-bodied candles, indicating hesitation and weakening momentum near resistance. No convincing bullish engulfing or three white soldiers patterns have appeared to confirm a breakout. Structurally, Bitcoin has been making higher lows since the November lows, maintaining a medium-term recovery trend. However, if Bitcoin cannot effectively close above $94,200, this downward move remains a correction within a broader downtrend.
The 38.2% Fibonacci retracement at $90,900 is the most critical support level. This price level is derived from the high of $107,700 to the low of $80,500, representing a key Fibonacci retracement in technical analysis. A break below $90,900 could lead to a test of $86,970 (23.6% retracement), followed by further declines toward the demand zone between $80,500 and $82,000. This stepwise decline provides traders with a clear risk management framework.
Shrinking Trading Volume Indicates Waning Buying Power
The second reason for Bitcoin’s decline today is the significant contraction in trading volume. According to CoinMarketCap data, Bitcoin’s 24-hour trading volume decreased 5.2% to $46.9 billion. More broadly, the total trading volume in the crypto industry fell 14% to $117.4 billion. This combination of price decline with shrinking volume usually suggests that buying strength is waning rather than active selling.
Trading volume is a key indicator to validate price movements. Ideally, upward moves should be accompanied by increasing volume, indicating genuine buying interest. Conversely, when prices hover at high levels with declining volume, it often signals that bulls are gradually retreating. This volume-price divergence is a classic sign of an impending trend reversal. Currently, Bitcoin is in this dangerous divergence state.
Three Major Technical Warnings for Bitcoin’s Decline
Triple Top Resistance Confirmed: Three failed attempts at $94,100 show strong selling pressure and exhausted bulls
Continuous Volume Contraction: 24-hour volume down 5.2%, a typical feature of waning buying power
Weakening K-line Patterns: Long upper shadows and small bodies indicate hesitation, lacking strong breakout signals like bullish engulfing
From a volatility perspective, Bitcoin’s realized volatility has been steadily decreasing over the past week. Low volatility environments often precede trend changes, and the current low volatility may be the calm before the storm. Historical data shows that after prolonged low volatility, Bitcoin often experiences sharp daily swings of 5%-10%, in either direction.
Why Morgan Stanley ETF Application Fails to Boost the Market

(Source: SEC)
The third question about Bitcoin’s decline today is: Morgan Stanley submitted a spot Bitcoin ETF application to the U.S. SEC this week. This should be a major positive, so why did it fail to lift prices and instead lead to a decline? The filing outlines Morgan Stanley’s proposed Bitcoin Trust, which aims to track the spot Bitcoin price net of fees.
Currently, spot Bitcoin ETFs manage over $120 billion, representing a significant portion of Bitcoin’s total market cap. For Morgan Stanley, issuing its own ETF allows closer integration into client portfolios and capturing management fees previously flowing to firms like BlackRock and Fidelity. This marks the birth of the first Bitcoin fund directly initiated by a major U.S. bank.
However, the market’s reaction to this news has been tepid, possibly for three reasons. First, the “priced in” effect. Rumors of Morgan Stanley’s ETF application have circulated for weeks, and the price may have already reflected this expectation in advance. When the official announcement arrives, it becomes a “sell the news” event. Second, ETF approval can take months, so no immediate substantial capital inflow is expected. Third, institutional investors might be “selling the news,” reducing their holdings upon positive developments to lock in profits.
The U.S. 10-year Treasury yield was at 4.134% at 3 p.m. (Eastern Time) Wednesday, down from 4.175% on Tuesday; the 5-year Treasury yield fell from 3.717% to 3.689%. Falling bond yields typically indicate rising risk aversion and capital flow into safe assets. In this macro environment, Bitcoin, as a risk asset, faces selling pressure.
Disclaimer: The information on this page may come from third parties and does not represent the views or opinions of Gate. The content displayed on this page is for reference only and does not constitute any financial, investment, or legal advice. Gate does not guarantee the accuracy or completeness of the information and shall not be liable for any losses arising from the use of this information. Virtual asset investments carry high risks and are subject to significant price volatility. You may lose all of your invested principal. Please fully understand the relevant risks and make prudent decisions based on your own financial situation and risk tolerance. For details, please refer to
Disclaimer.
Related Articles
Strategy Acquires 1,031 BTC in Smaller Weekly Purchase
Strategy, led by Michael Saylor, purchased 1,031 BTC for $76.6M, bringing total holdings to 762,099 BTC. This more measured acquisition follows previous larger buys and is funded through common stock sales. Current holdings are valued around $54B, about 7% below acquisition cost.
CryptoFrontNews17m ago
# Gold and BTC Diverge: A Battle Over the Definition of Safe-Haven Assets
# Woke up, and BTC pulled back to 70k. On the drive this morning, the radio was reporting that gold came under pressure as the Fed's March FOMC meeting failed to meet rate cut expectations, erasing all gains for the year so far.
Recently, geopolitical tensions in the Middle East have escalated, causing global capital markets to shake. According to classical narratives in traditional finance, geopolitical conflicts should push up gold prices—a logic rooted in gold's thousands of years of safe-haven attributes, long since becoming the instinctive reaction of market participants. Yet the market performance in March 2026 has shattered this stereotype: gold prices continued to decline, breaking through the critical support level of $4,500, while Bitcoin's decline was far smaller than traditional risk assets like stocks, displaying a certain characteristic of "relative safe-haven."
This anomalous divergence, on the surface is a difference in asset price movements, but at a deeper level reflects a structural change long overlooked by the market: the investor base for gold and Bitcoin is undergoing a fundamental shift
金色财经_20m ago
Wall Street broker Bernstein calls bitcoin bottom, keeps $150,000 year-end target
Wall Street broker Bernstein sees Bitcoin likely at its bottom, targeting $150,000 by year-end. Analyst Gautam Chhugani cites strong demand and institutional interest, while emphasizing resilient assets like Strategy (MSTR) as a Bitcoin proxy amidst market volatility.
CoinDesk31m ago
Bernstein: Bitcoin May Have Hit Cyclical Bottom, Maintains $150,000 Target Price by End of 2026
Gate News reports that on March 24, according to CoinDesk, Wall Street brokerage Bernstein stated in its latest report that Bitcoin may have already reached a cyclical bottom, while maintaining a price target of $150,000 by the end of 2026. The report notes that previous pullbacks were mainly driven by high interest rate environments, Middle East geopolitical risks, and ETF outflows during a certain period, but the overall fundamentals have not experienced systemic pressure. Additionally, sustained ETF inflows and corporate treasury accumulation continue to be viewed as important factors driving Bitcoin's upside.
GateNews32m ago
