- MemeCore is trading in a narrow range, suggesting short-term consolidation.
- Support near $1.55 and resistance at $1.89 will be key levels to watch.
MemeCore (M) has been moving sideways in recent weeks, with the price currently around $1.69. After a period of decline, the token is now showing early signs of stabilization, trading in a narrow range between support and resistance. The chart suggests that MemeCore may be forming a short-term consolidation pattern, sometimes referred to as a rectangle or range-bound structure, where the price oscillates between defined support and resistance levels.
Over the past 24 hours, the price of this memecoin climbed about 3%, reaching an intraday high of $1.71 and a low of $1.62. Its market cap currently stands at $2.1 billion, with a trading volume of $14.7 million.
Sideways Momentum Suggests the Market Is Taking a Breather
Looking at the 24 hours trading pattern, MemeCore is positioned between the 50-day moving average at $1.555 and the 100-day moving average at $1.889. The 50-day moving average is slowly flattening, indicating that immediate selling pressure is easing. The 100-day moving average remains above the current price, suggesting the broader trend is still slightly weak. Overall, the averages show that the market is in a recovery phase but hasn’t fully returned to an uptrend yet.
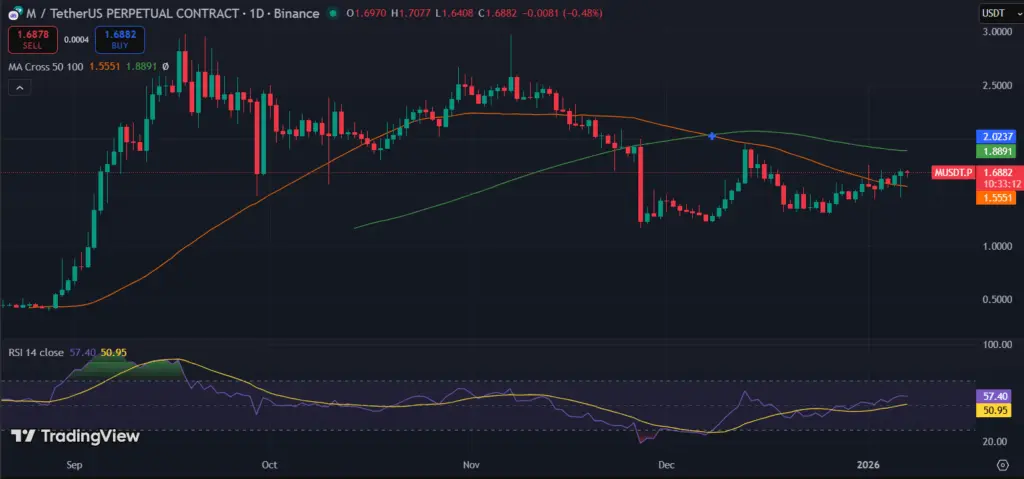 (Source: TradingView)MemeCore’s daily RSI stands at 57, showing that momentum is mildly positive. This indicates that buyers are gradually returning, but there isn’t a strong push higher yet. The market isn’t oversold or overbought, which fits with the sideways price action seen on the chart.
Immediate support is around $1.55–$1.56, which has helped prevent further declines in recent sessions. A stronger support level exists near $1.50, which could provide a safety net if the price dips further. On the upside, MemeCore’s resistance is seen at $1.89, near the 100-day moving average, followed by $2.02, which previously acted as a barrier. Breaking above these levels would be necessary for any meaningful upward movement.
Disclaimer: The information on this page may come from third parties and does not represent the views or opinions of Gate. The content displayed on this page is for reference only and does not constitute any financial, investment, or legal advice. Gate does not guarantee the accuracy or completeness of the information and shall not be liable for any losses arising from the use of this information. Virtual asset investments carry high risks and are subject to significant price volatility. You may lose all of your invested principal. Please fully understand the relevant risks and make prudent decisions based on your own financial situation and risk tolerance. For details, please refer to
Disclaimer.
Related Articles
Is Injective (INJ) a Dead Coin or the Next 2800% Opportunity? Here’s What The Chart Is Saying
The Injective price has fallen sharply from its previous all-time high, leading some traders to question whether the project has lost its momentum.
However, a recent technical analysis shared by top analyst Crypto Patel suggests that the recent decline may actually represent a typical
CaptainAltcoin1h ago
CFX 4-hour chart reaches a new high for the phase, with approximately 14% increase over 24 hours
Gate News: On March 15, market data shows that CFX reached a new phase high on the 4-hour K-line chart, with prices touching approximately 0.06282 USDT at their peak, representing a 24-hour gain of around 14%. Some community members believe this rally may be related to recent macroeconomic catalysts. Earlier, media outlets citing sources reported that Iran is considering allowing certain tankers to pass through the Strait of Hormuz on the condition that petroleum transport be settled in Chinese yuan. Related discussions have once again sparked market attention toward yuan stablecoins and cross-border payment narratives.
GateNews2h ago
After the network upgrade: What prospects await SOL?
The official approval of protocol SIMD-0266 aims to optimize computing efficiency on the Solana network by introducing p-tokens, simplifying transaction processing. This upgrade, set for April, has prompted increased buying activity and could lead to significant cost reductions and performance improvements.
TapChiBitcoin3h ago
Track FET's journey to the $0.24 milestone as the AI cryptocurrency sector records its most positive trading week in months
The cryptocurrency industry related to AI has recently recorded an impressive performance. According to data from CoinMarketCap, the total market capitalization of this sector has grown 16% in just the past week. Many leading tokens in this category have also achieved significant growth, attracting
TapChiBitcoin3h ago
DeFi enters a "winter of yields": liquidity stagnation, leverage contraction, and the disappearance of arbitrage opportunities
Since September 2025, the DeFi market has entered a "interest rate winter," with the annualized deposit yields of mainstream stablecoins dropping to lows, and supply and demand imbalances causing excess liquidity. As borrowing demand declines, stablecoin lending rates have also decreased, and the reduced risk appetite in the crypto market has led investors to shift toward more stable assets. Some protocols, such as Sky, offer stable returns through real-world assets, but the overall trend still indicates a period of adjustment and structural reform in DeFi.
区块客3h ago