
**Date: **Fri, Jan 02, 2026 | 06:40 PM GMT
The broader cryptocurrency market has started the new year with modest strength, as both Bitcoin (BTC) and Ethereum (ETH) trade in the green with gains of over 2%. While several altcoins are regaining momentum, the privacy-focused token Monero (XMR) has remained relatively flat in comparison.
XMR is trading with mild gains, but more importantly, its daily chart structure suggests the recent pullback may be a healthy bullish retest rather than a sign of trend exhaustion.
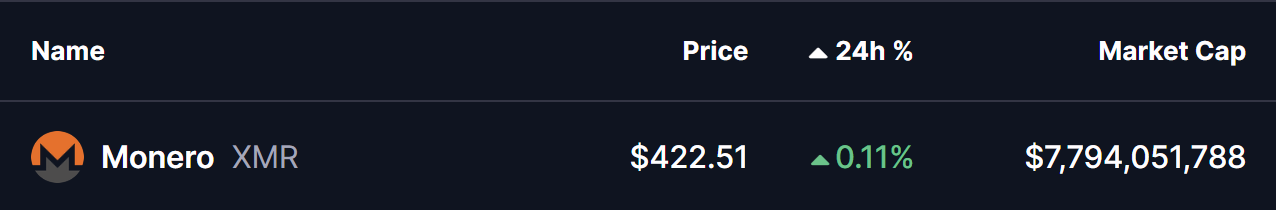
Source: Coinmarketcap
Retesting the Cup and Handle Breakout
On the daily timeframe, XMR had been consolidating within a well-defined Cup and Handle pattern — a classic bullish continuation formation that often precedes strong upside moves once the neckline is cleared.
Earlier, bulls decisively broke above the $412–$420 neckline resistance, triggering a sharp rally of nearly 20% from the breakout base to a local high around $498.30. This move confirmed the pattern’s validity and signaled a clear shift in market structure toward the upside.
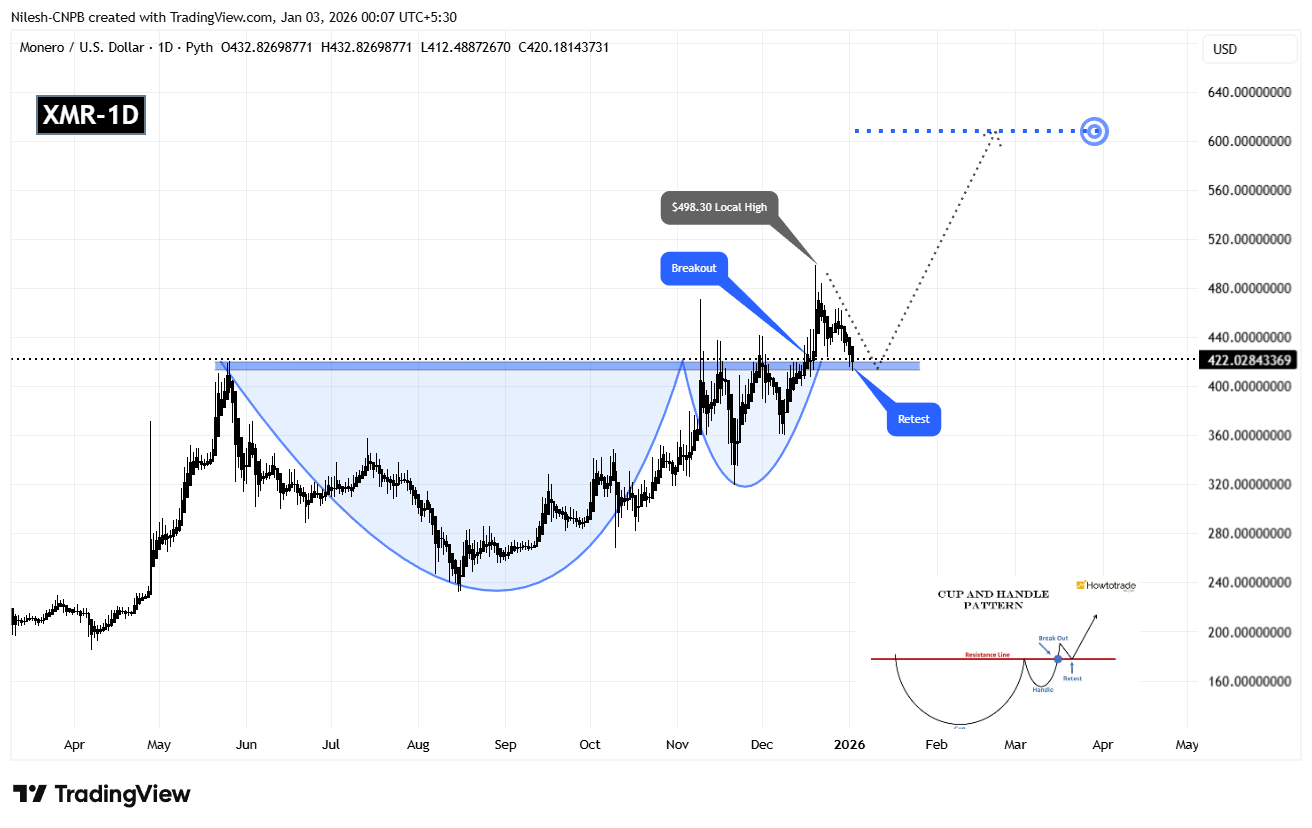
Monero (XMR) Daily Chart/Coinsprobe (Source: Tradingview)
Following that initial breakout surge, XMR entered a natural cooldown phase. The recent dip has brought price back toward the $412–$420 zone, where buyers have stepped in once again. This area now acts as a textbook resistance-turned-support level. Such retests are common after strong breakouts and often serve as a launchpad for the next impulsive move if demand holds firm.
What’s Next for XMR?
As long as buyers continue to defend the $412–$420 neckline zone, the broader bullish structure remains intact. A sustained push back above the recent swing high near $498 would likely signal renewed momentum and confirm continuation of the breakout.
Based on the depth of the cup formation, the technical upside projection points toward the $608 region. This would represent a potential upside of roughly 43% from current levels if momentum accelerates.
On the downside, a failure to hold the $412–$420 support range could temporarily weaken bullish momentum and delay the continuation scenario. However, the larger structure would still remain constructive as long as price stays well above the cup’s base.
For now, XMR appears to be in a crucial confirmation phase. How price reacts around this key support zone in the coming sessions will likely determine whether Monero transitions into a full-scale continuation rally or spends more time consolidating before its next move.
Disclaimer: The views and analysis presented in this article are for informational purposes only and reflect the author’s perspective, not financial advice. Technical patterns and indicators discussed are subject to market volatility and may or may not yield the anticipated results. Investors are advised to exercise caution, conduct independent research, and make decisions aligned with their individual risk tolerance.
About Author: Nilesh Hembade is the Founder and Lead Author of Coinsprobe, with over 5 years of experience in the cryptocurrency and blockchain industry. Since launching Coinsprobe in 2023, he has been providing daily, research-driven insights through in-depth market analysis, on-chain data, and technical research.
Disclaimer: The information on this page may come from third parties and does not represent the views or opinions of Gate. The content displayed on this page is for reference only and does not constitute any financial, investment, or legal advice. Gate does not guarantee the accuracy or completeness of the information and shall not be liable for any losses arising from the use of this information. Virtual asset investments carry high risks and are subject to significant price volatility. You may lose all of your invested principal. Please fully understand the relevant risks and make prudent decisions based on your own financial situation and risk tolerance. For details, please refer to
Disclaimer.
Related Articles
JPMorgan: After Iran War, ETF Funds Diverge, Gold Loses Favor as Bitcoin Sees Inflows
JPMorgan's report indicates that since the Iran war, there has been a significant divergence in fund flows between Bitcoin and gold ETFs, with gold ETF (GLD) experiencing outflows of approximately 2.7%, while Bitcoin ETF (IBIT) attracting 1.5% inflows. Analysis shows that institutional investors are reducing Bitcoin exposure while increasing gold holdings, IBIT's options strategies are becoming increasingly complex, and Bitcoin's volatility is narrowing, indicating improving market structure.
MarketWhisper6m ago
Why Did Bitcoin Rise Today? Gold Safe-Haven Sentiment Easing, Institutions See Net Inflows for Third Consecutive Week into Digital Assets
Since the end of February when the U.S.-Israel coalition bombed Iran, Bitcoin's price has risen approximately 6%, outperforming both gold and U.S. stocks. Institutional investors continue to contribute positive net inflows to digital assets, demonstrating Bitcoin's appeal as a safe-haven asset. As U.S. Treasury yields rise, the safety perception of traditional safe-haven assets faces challenges, while Bitcoin benefits from its non-sovereign nature. Technical analysis indicates $72,000 as a key resistance level, with potential for further gains upon a breakout.
MarketWhisper11m ago
CryptoQuant: Ethereum Faces "Adoption Paradox," ETH Could Drop to $1,500
Ethereum is facing an "adoption paradox," with network activity reaching all-time highs while ETH price has declined significantly. CryptoQuant analysis indicates that if the bear market persists, ETH could fall to $1,500. The relationship between exchange inflows and price dynamics is more pronounced, suggesting ETH is facing strong selling pressure.
GateNews55m ago
Today's cryptocurrency Fear and Greed Index dropped to 15, with the market still in extreme panic mode
Gate News: On March 13, according to Alternative.me data, the Cryptocurrency Fear and Greed Index fell to 15 today, down further from yesterday's 18, with the market still in an "extreme fear state."
GateNews59m ago
ETH 15-minute increase of 0.79%: Liquidity phase decline and short-term fund arbitrage resonance driving upward momentum
March 13, 2026, 00:00 to 00:15 (UTC), Ethereum (ETH) experienced a significant upward price movement in a short timeframe, with the 15-minute interval return reaching +0.79%. The price range was 2070.45 to 2090.33 USDT, with a volatility amplitude of 0.96%. Market fluctuations intensified during this period, capturing traders' attention.
The primary driver of this price movement was a phase-wise decline in market liquidity. During this period, there were no on-chain large transfers, DeFi liquidations, or significant derivatives liquidations recorded. Major macro and industry news updates also showed no sudden events. During the Europe-US trading session
GateNews59m ago
BTC 15-minute surge of 0.84%: On-chain fund flow and technical breakout synergy drive volatility
March 13, 2026, 00:00 to 00:15 (UTC), BTC price fluctuated within the range of 70394.0 to 71116.3 USDT in just 15 minutes, with a return rate of +0.84% and volatility amplitude reaching 1.02%. During this period, mainstream market attention increased, driving active trading and notably elevated price volatility, reflecting a marked warming of market sentiment during this timeframe.
The primary driver of this price movement was large on-chain fund transfers and concentrated whale account buying activity. Historical on-chain data observations show that single transfers exceeding 1000 BTC have frequently served as catalysts for upward price movements.
GateNews59m ago