
The Bittensor (TAO) price has spent the past few weeks doing something it rarely does: moving quietly. After a sharp sell-off that cleared excess leverage, TAO found support, stopped going lower, and began rebuilding from a clear demand zone.
That process has pushed price back into a well-defined area, where the next move is likely to matter.
Top analyst CyrilXBT shared on X that this is how strong narrative-driven coins often behave after a big cycle move. First comes the flush. Then comes structure. The TAO price appears to be in that second phase now.
- What the Bittensor Chart Is Showing
- Why This Looks Like Accumulation
- What Comes Next for TAO Price
What the Bittensor Chart Is Showing
On the daily chart, TAO has carved out a clean range after the late-2025 drawdown. Price dropped hard, shook out weak positions, and then stabilized instead of drifting lower. From there, it started to grind higher without the kind of wild swings that usually come with speculative bounces.
That grind matters. Rather than chopping aimlessly, the TAO price has been pushing back toward a clear breakout zone. The structure is easy to read, with defined support below and resistance above. There’s no mess on the chart, and that’s exactly what stands out.
The recent push higher hasn’t come with explosive volume, which supports the idea that this is accumulation rather than distribution. When sellers step aside and buyers absorb supply quietly, price often tightens before making a decision.
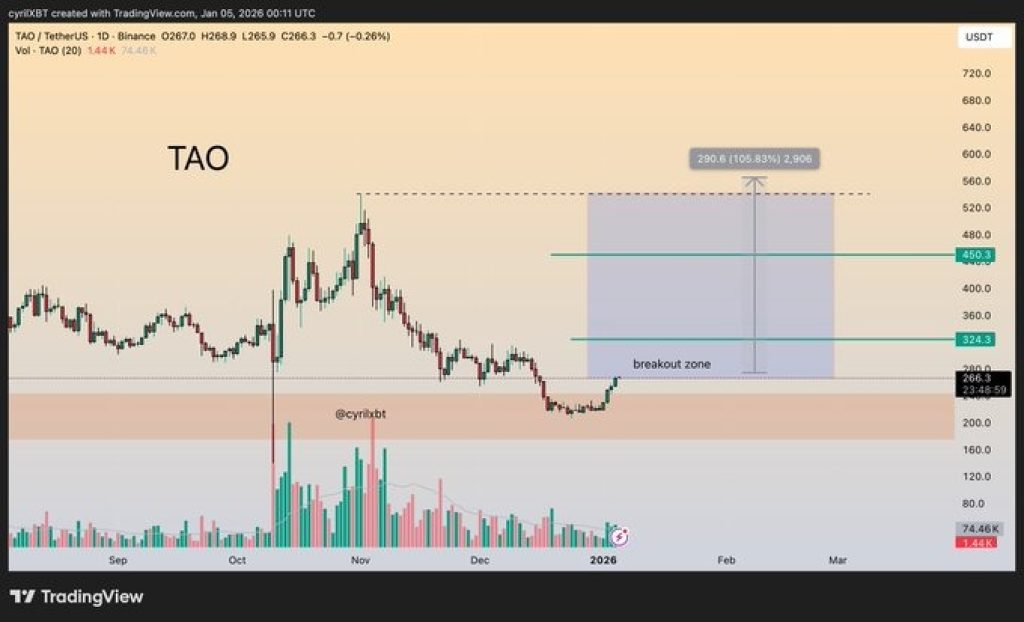
Source: X/CyrilXBT
Why This Looks Like Accumulation
One of the key points in CyrilXBT’s analysis is the lack of chaos. After a major flush, weaker setups usually turn into noisy, sideways action. TAO hasn’t done that. Instead, it found demand quickly and began respecting clear levels.
There’s also a clean invalidation point on the chart. If the TAO price were to lose the lower end of the range, the bullish structure would break. Until that happens, the setup remains intact. That kind of clarity is rare, especially in volatile markets.
TAO also has a history of long periods of inactivity followed by sharp moves. It doesn’t trend often, but when it does, the move tends to be decisive.
_****Here’s Why a Top YouTuber Says $10,000 XRP Is the Wrong Conversation**
What Comes Next for TAO Price
If TAO breaks out of the current range and holds above it, the chart opens up for a measured move higher. With little resistance overhead, momentum could build quickly once price escapes the range.
If the breakout fails, the downside risk remains defined. A rejection would likely send price back into consolidation rather than trigger immediate collapse, as long as demand continues to hold.
For now, the Bittensor price is doing exactly what strong setups do after a reset. It flushed excess, rebuilt the structure, and moved back into a zone where direction will soon be decided. Whether that decision comes this week or later, the chart suggests TAO is getting closer to making it.
Disclaimer: The information on this page may come from third parties and does not represent the views or opinions of Gate. The content displayed on this page is for reference only and does not constitute any financial, investment, or legal advice. Gate does not guarantee the accuracy or completeness of the information and shall not be liable for any losses arising from the use of this information. Virtual asset investments carry high risks and are subject to significant price volatility. You may lose all of your invested principal. Please fully understand the relevant risks and make prudent decisions based on your own financial situation and risk tolerance. For details, please refer to
Disclaimer.
Related Articles
Ethereum Eyes Bullish Breakout – Analysts Predict Potential Rally to $2,500 As Scarcity Increases
The cryptocurrency market is currently at a crucial technical juncture for ETH. The second largest digital asset is poised for a structural change, with Ethereum testing a critical resistance zone near $2,150 in mid-March 2026. A breakthrough above that level is the main signal technical analysts ne
BlockChainReporter1m ago
BTC 15-minute gain of 0.63%: ETF positive news combined with institutional fund inflows triggers breakthrough
From 2026-03-15 22:30 to 2026-03-15 22:45 (UTC), BTC rose 0.63% within 15 minutes, with a price range of 71926.4 to 72500.0 USDT and a volatility amplitude of 0.80%. During the same period, trading volume increased notably with buy-side dominance, market attention heated up, and fluctuation intensity exceeded the intraday average, reflecting rising sentiment and active short-term trading activity.
The main driver of this price movement is a macro positive catalyst: The US SEC released a positive statement regarding bitcoin ETF approval progress at 22:00, which directly bolstered
GateNews19m ago
Analyst Says Bitcoin Indicators Show Early Signs of Market Recovery
Stablecoin liquidity rose by ~$8B since February, signaling potential improved market trading conditions.
Inter-exchange Flow Pulse turned positive, indicating more Bitcoin moving to derivatives platforms.
Long-term holders retain ~79% of supply, showing gradual supply transfers rather
CryptoFrontNews2h ago
Dogecoin at a Turning Point — Will $0.094 Resistance Finally Break?
Dogecoin was trading between $0.0925 and $0.09173 with the price stabilizing around $0.0925.
The immediate $0.09443 resistance caps the current range. A move above this level could expand today’s trading activity.
Past historical price movements coincide with a number of trend support res
CryptoNewsLand3h ago
XRP Breaks $1.40 Resistance as Volume Surge Lifts Momentum
Key Insights
XRP surged past the $1.40 resistance after trading volume climbed nearly 13%, signaling renewed trader interest and stronger short-term momentum.
Ripple’s collaboration with Mastercard through the Crypto Partner program increased market attention as investors anticipate
CryptoNewsLand3h ago
XRP Price Structure Tightens While Heatmap Highlights $1.30 Liquidity Zone
XRP trades near $1.37 support after a 0.9% daily decline, while the $1.44 level remains the immediate resistance in the current range.
A three-week liquidity heatmap highlights a large order cluster around $1.30, indicating a strong liquidity zone below price.
A three-month Gaussian
CryptoNewsLand4h ago