
Date: Thu, Jan 01, 2026 | 10:30 AM GMT
As the new year 2026 begins, the broader cryptocurrency market is showing modest weakness, with both Bitcoin (BTC) and Ethereum (ETH) trading slightly in the red. This soft start has weighed on sentiment across the altcoin space as well, including Monad (MON). However, beneath the surface, MON’s chart structure is beginning to tell a more constructive story.
MON is currently down around 4% on the day, extending its 60-day decline to roughly 21%. While short-term price action remains subdued, the more important signal is emerging on the daily chart, where price structure is beginning to hint at a meaningful shift. If confirmed, this setup could mark the early stages of a bullish continuation following a prolonged corrective phase.
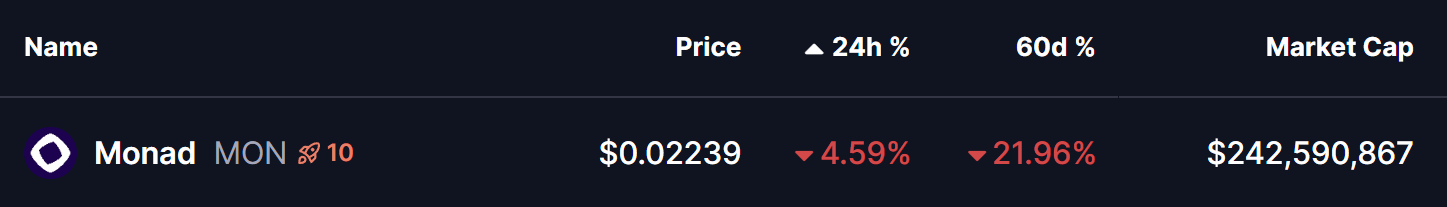
Source: Coinmarketcap
Rounding Bottom in Play
On the daily timeframe, MON appears to be forming a textbook rounding bottom pattern — a classic bullish reversal structure that typically develops after extended downside pressure. This pattern reflects a gradual transition from distribution to accumulation, where selling momentum weakens and buyers begin to step in more consistently.
Previously, MON faced strong rejection near the $0.04923 neckline zone, triggering a sharp decline that unfolded through late November and December. That move eventually found a floor near the $0.017 level, which has since acted as a key demand zone. Repeated defenses of this area prevented any deeper breakdown and helped establish a stable base for a potential trend reversal.
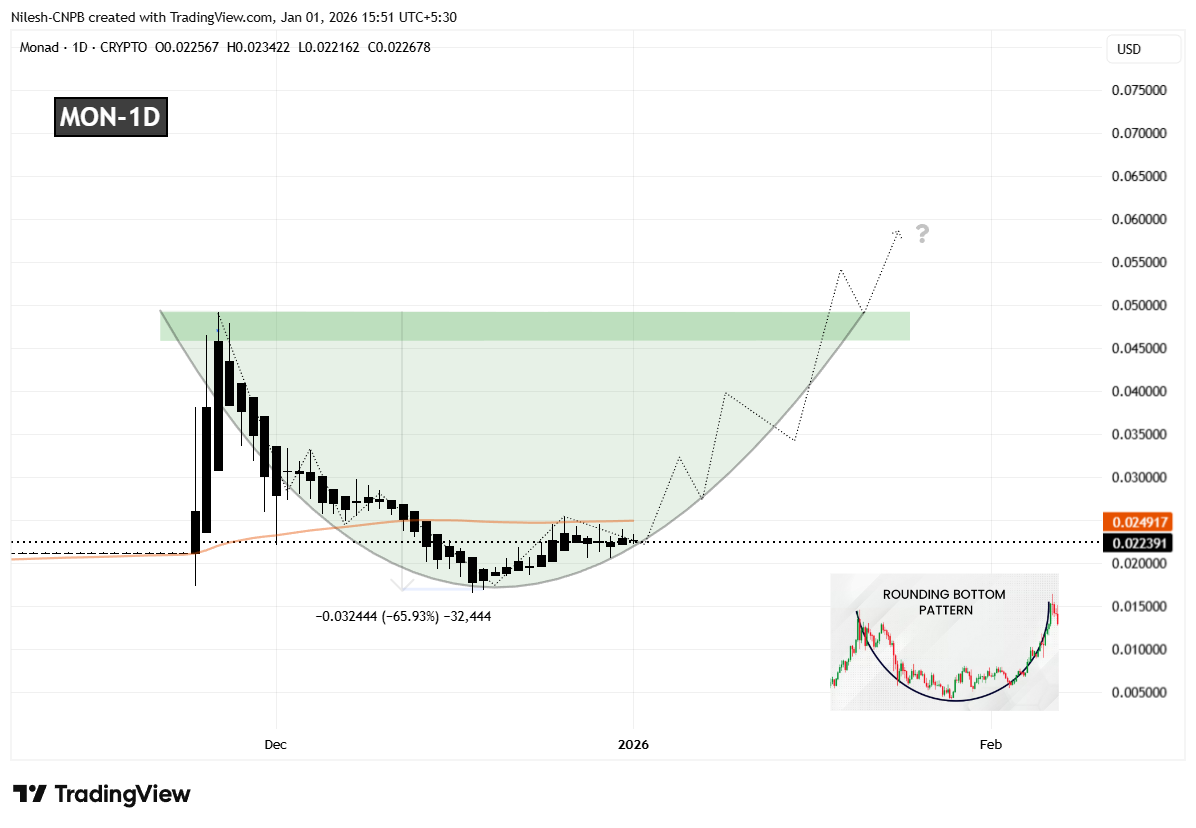
Monad (MON) Daily Chart/Coinsprobe (Source: Tradingview)
Since forming that bottom, MON has started to curve higher in a rounded fashion, closely matching the classic structure of a developing bottoming pattern. This gradual recovery suggests that selling pressure is fading rather than accelerating. The recent stabilization and recovery back above the $0.022 region further indicate that accumulation may be taking place as the market quietly prepares for a larger move.
What’s Next for MON?
For the rounding bottom pattern to move into confirmation, MON needs to reclaim the 50-day moving average, currently positioned near the $0.02491 level. A sustained move above this area would signal a shift in short-term momentum and confirm that buyers are beginning to regain control after months of corrective price action.
Looking ahead, the most significant technical hurdle remains the neckline resistance around $0.04923. A clean and decisive breakout above this zone would validate the entire reversal structure and could open the door for a broader bullish expansion phase, with momentum traders likely returning to the market.
Until those levels are reclaimed, the pattern remains in its early development stage. Short-term pullbacks or consolidation remain possible if MON struggles near the 50-day moving average. However, as long as price continues to hold higher lows above the $0.017 base, the broader bottoming structure remains intact.
Overall, MON’s emerging rounding bottom formation suggests the token may be approaching an important inflection point. While confirmation is still pending, the improving structure and alignment with a classic bullish pattern indicate that the coming sessions could be decisive for Monad’s next directional move.
Disclaimer: The views and analysis presented in this article are for informational purposes only and reflect the author’s perspective, not financial advice. Technical patterns and indicators discussed are subject to market volatility and may or may not yield the anticipated results. Investors are advised to exercise caution, conduct independent research, and make decisions aligned with their individual risk tolerance.
About Author: Nilesh Hembade is the Founder and Lead Author of Coinsprobe, with over 5 years of experience in the cryptocurrency and blockchain industry. Since launching Coinsprobe in 2023, he has been providing daily, research-driven insights through in-depth market analysis, on-chain data, and technical research.
Disclaimer: The information on this page may come from third parties and does not represent the views or opinions of Gate. The content displayed on this page is for reference only and does not constitute any financial, investment, or legal advice. Gate does not guarantee the accuracy or completeness of the information and shall not be liable for any losses arising from the use of this information. Virtual asset investments carry high risks and are subject to significant price volatility. You may lose all of your invested principal. Please fully understand the relevant risks and make prudent decisions based on your own financial situation and risk tolerance. For details, please refer to
Disclaimer.
Related Articles
Crypto market rebounds this morning, BTC touches $72,000, funding rates return to neutral
The crypto market rebounded on March 13, with Bitcoin recovering to 72,000 USD and Ethereum recovering to 2148 USD. Funding rates on major exchanges returned to neutral levels, indicating that bearish sentiment has eased. The funding rate is a mechanism that adjusts the relationship between contract prices and asset prices.
GateNews3m ago
Cardano Price Near Key Pivot as Macro Liquidity Signals Shift
Key Insights
Analyst Dan Gambardello links Cardano’s monthly RSI reset and macro liquidity cycles to conditions that previously preceded ADA’s explosive 2020–2021 rally.
ADA trades near $0.26 while the $0.288 moving average forms resistance, and the $0.24 to $0.25 zone continues acting as
CryptoFrontNews20m ago
Solana Tests $90 Resistance as Fibonacci Confluence Signals Key Turning Point
Key Insights
Solana price is nearing a major resistance near $90 where Fibonacci retracement and value area levels align, creating a decisive technical barrier.
Market structure shows the rally forming part of an ABC corrective pattern, keeping the broader consolidation intact while price tr
CryptoFrontNews25m ago
Easing oil price surge! US Treasury Secretary: Open to purchasing Russian offshore oil, Bitcoin breaks through 72,000
The United States temporarily opened purchases of stranded Russian oil at sea to ease soaring oil prices, causing oil prices to decline. Bitcoin surged past $72,000. Meanwhile, gold ETFs experienced capital outflows, indicating increased institutional participation in the Bitcoin market and improved market liquidity.
CryptoCity25m ago
VanEck: Bitcoin Miners Sitting on a "Gold Mine," AI Demand Market Not Yet Priced In
Bitcoin mining has advantages in transitioning toward artificial intelligence (AI) because it already possesses mature electrical infrastructure and resources that can flexibly respond to grid demands. The market has not fully reflected this potential, resulting in a valuation gap. Major mining companies are adjusting their strategies to pursue AI business to counteract the impact of declining hash rates.
MarketWhisper1h ago
CryptoQuant Reveals Ethereum's "Adoption Paradox": Users Double While Funds Flee, ETH Could Plunge to $1500 by Year-End
Ethereum's activity reaches an all-time high, but price falls sharply due to fund outflows, with realized value turning negative. If the bear market continues, ETH is predicted to potentially drop to $1,500. Analysis indicates that network usage growth cannot support asset performance, and Layer 2 scaling poses pressure on ETH. The market shows significant divergence over Ethereum's future value.
動區BlockTempo1h ago