Cardano (ADA) records a nearly 4% increase on Monday, pushing the price close to the psychological level of $0.40. Signals from the derivatives market clearly reflect an improvement in investors’ risk appetite, as open interest (OI) on ADA futures contracts, along with the number of long positions, are simultaneously increasing. On the technical side, the trend picture continues to lean positive: market momentum is being reinforced, opening up room for ADA to challenge higher resistance levels in the near future.
Increased buying position thanks to stable DEX volume on Cardano
Data from Taptools shows a significant breakout in transaction volume within the Cardano ecosystem, rising from $3.19 million on Thursday to $4.06 million on Sunday. This development indicates a notable recovery in community interest, a trend that has remained stable since Cardano launched a privacy-focused sidechain called Midnight.
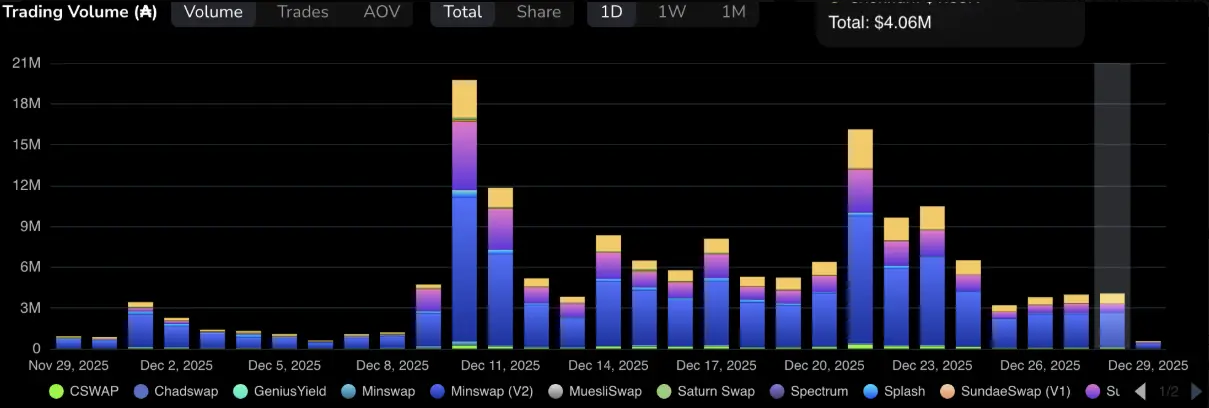 Cardano Transaction Volume | Source: TaptoolsIn the derivatives market, data from CoinGlass indicates that open contracts of Cardano futures have increased by 2.33% within 24 hours, reaching $729.41 million. This reflects a bullish sentiment among traders, with a higher risk appetite being demonstrated.
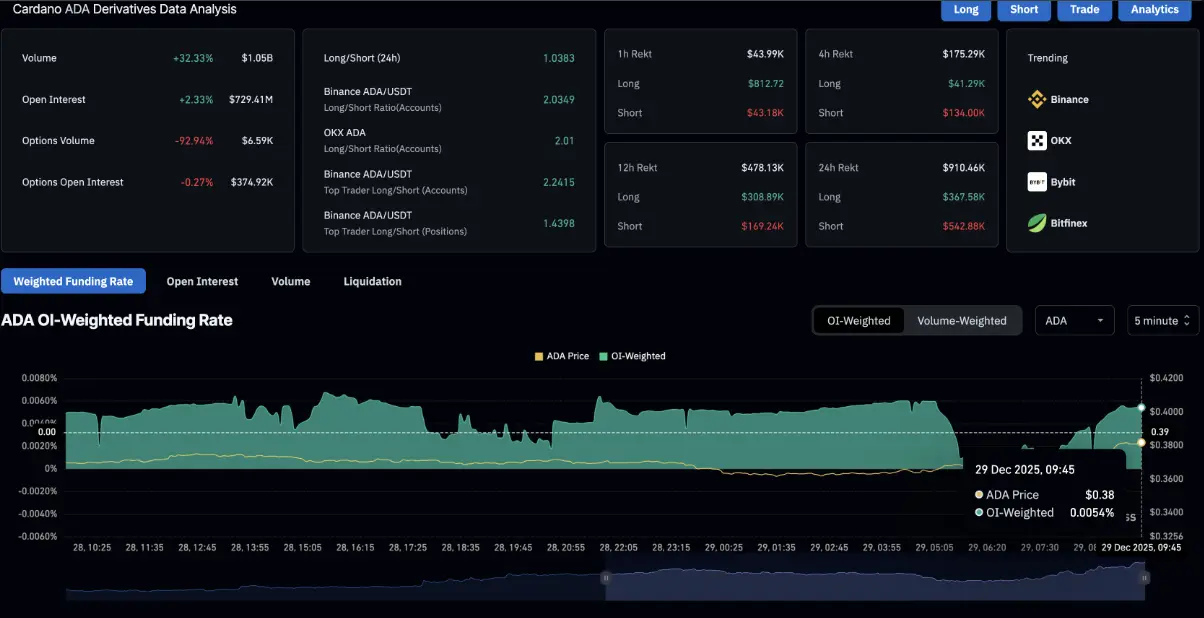 Cardano Derivatives Products | Source: CoinGlassNotably, the funding rate based on OI stands at 0.0054%, suggesting a bullish bias as traders are willing to pay fees to maintain long positions. Meanwhile, the long/short ratio increased to 54.73% on Monday, compared to 48.42% on the previous Sunday. If the accumulation of long positions continues to strengthen, Cardano is likely to enter a new bullish phase, driven strongly by leverage in the market.
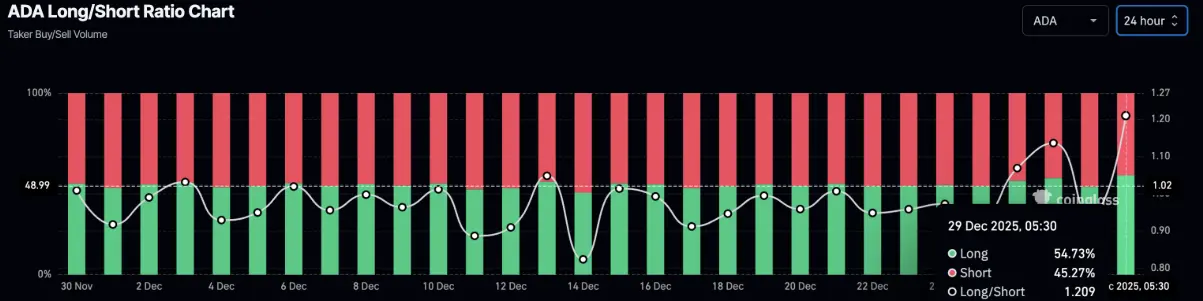 Long/Short Ratio Chart of Cardano | Source: CoinGlass## Technical Outlook: Can Cardano Break the $0.40 Level?
Cardano recorded a nearly 4% gain on Monday, continuing its recovery after a clear bullish divergence appeared on the RSI indicator, formed between the two lows on 12/18 and 12/25. The upward momentum of ADA is currently heading toward the resistance trendline established by connecting the peaks on 10/28 and 12/09, around the $0.40 level on the daily logarithmic chart.
In a positive scenario, if ADA convincingly breaks above $0.40, the price is likely to move toward the 50-day exponential moving average (EMA) at $0.4379, serving as the next resistance target.
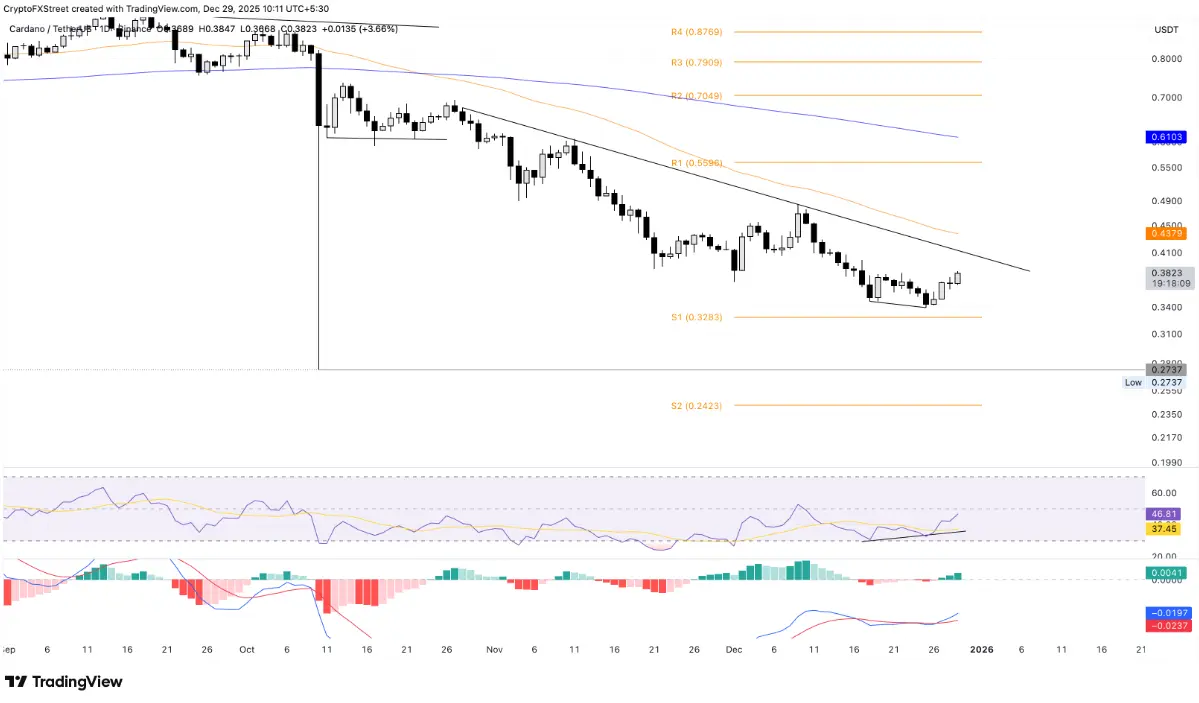 Daily ADA/USDT Chart | Source: TradingViewTechnical signals on the daily timeframe indicate that market momentum is gradually improving toward a neutral to positive outlook. The RSI indicator is currently at 46 and continues to rise toward the midline, reflecting weakening selling pressure. At the same time, MACD lines are approaching the zero line after forming a bullish cross at the end of last week, suggesting the upward trend is being reinforced.
Conversely, if ADA reverses and corrects, the S1 Pivot Point at $0.3283 could become an important support level, helping the price temporarily stabilize before facing selling pressure.
Disclaimer: The information on this page may come from third parties and does not represent the views or opinions of Gate. The content displayed on this page is for reference only and does not constitute any financial, investment, or legal advice. Gate does not guarantee the accuracy or completeness of the information and shall not be liable for any losses arising from the use of this information. Virtual asset investments carry high risks and are subject to significant price volatility. You may lose all of your invested principal. Please fully understand the relevant risks and make prudent decisions based on your own financial situation and risk tolerance. For details, please refer to
Disclaimer.
Related Articles
Solana Rebound Hopes Rise After TD Sequential Issues a Buy Signal on SOL
_TD Sequential flashes buy signal as Solana trades near $75–$80 support zone_
_SOL remains in downtrend with lower highs despite short-term stabilization signs_
_Resistance at $100 holds while RSI stays neutral and MACD shows weak momentum_
Solana Rebound Hopes Rise After TD Sequential
LiveBTCNews14m ago
ARK Invest Cuts Meta, Nvidia, and Bitcoin ETF Holdings as Markets Turn Volatile
ARK Invest's recent sale of shares in Meta, Nvidia, and its Bitcoin ETF marks a defensive shift amid rising geopolitical tensions and market volatility, aiming to lower risk and maintain liquidity, rather than abandoning its long-term growth strategies.
CryptometerIo37m ago
AVAX Struggles Below $9 Despite U.S. Digital Commodity Clarity
Avalanche's AVAX token struggles near $9 despite favorable U.S. crypto regulations, exhibiting weak investor confidence. Broader market negativity, tight liquidity, and external pressures overshadow potential growth, with critical support around $9 to $9.25.
CryptometerIo38m ago
Miners collectively transform into AI: Mining costs have inverted by nearly $20,000, selling Bitcoin to raise $7 billion for a shift in computing power.
Bitcoin mining is undergoing a structural transformation, with average mining costs for mining companies expected to reach $80,000 by the end of 2025, while the price of Bitcoin is only around $70,000. Mining companies are increasingly turning to artificial intelligence and high-performance computing, with total related contracts exceeding $70 billion. The funding for this transformation mainly comes from leveraged financing and the sale of Bitcoin reserves. Although there is a significant divergence in the valuations of mining companies, whether the price of Bitcoin can rebound to $100,000 will impact the future development of the mining industry.
BlockBeatNews1h ago
