The broader cryptocurrency market is showing relative strength today, with both Bitcoin (BTC) and Ethereum (ETH) trading in the green. This stability among the majors has helped improve sentiment across the altcoin space, and Zcash (ZEC) is now emerging as one of the tokens showing early signs of a momentum shift.
ZEC has managed to post nearly 9% gains, and more importantly, the combination of rising whale accumulation and a well-defined technical structure on the daily chart suggests that an upside move could be forming beneath the surface.
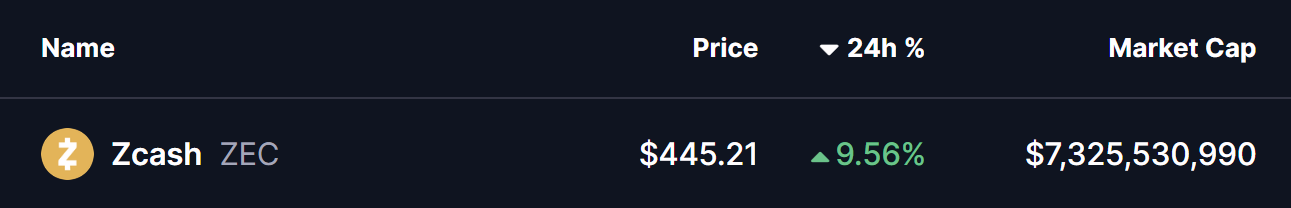
Source: Coinmarketcap
Major Whale Accumulation
On-chain data is beginning to support the bullish narrative. According to data shared by Lookonchain, a newly created wallet (t1XKfb) withdrew 30,000 ZEC worth approximately $13.25 million from Binance just nine hours ago. Large withdrawals of this nature typically reduce immediate selling pressure on exchanges and often signal long-term accumulation rather than short-term speculation.

$ZEC Whale Accumulation//Source: @lookonchain (X)
This whale activity aligns closely with ZEC’s improving technical posture, reinforcing the idea that larger players may be positioning ahead of a potential breakout.
Ascending Triangle Structure Takes Shape
On the daily chart, Zcash is forming a textbook ascending triangle, defined by a sequence of higher lows pressing steadily against a horizontal resistance zone. This pattern is widely viewed as a bullish continuation setup, especially when accompanied by accumulation activity.
ZEC recently faced rejection near the neckline resistance around $457, which pushed price back toward its rising support trendline near $404. However, each pullback has been met with strong buying interest, keeping the structure intact and preventing any deeper breakdown.
The latest rebound has carried ZEC back toward the $444 area, highlighting renewed buyer strength and suggesting that sellers are struggling to regain control. This price behavior reflects healthy consolidation rather than weakness.
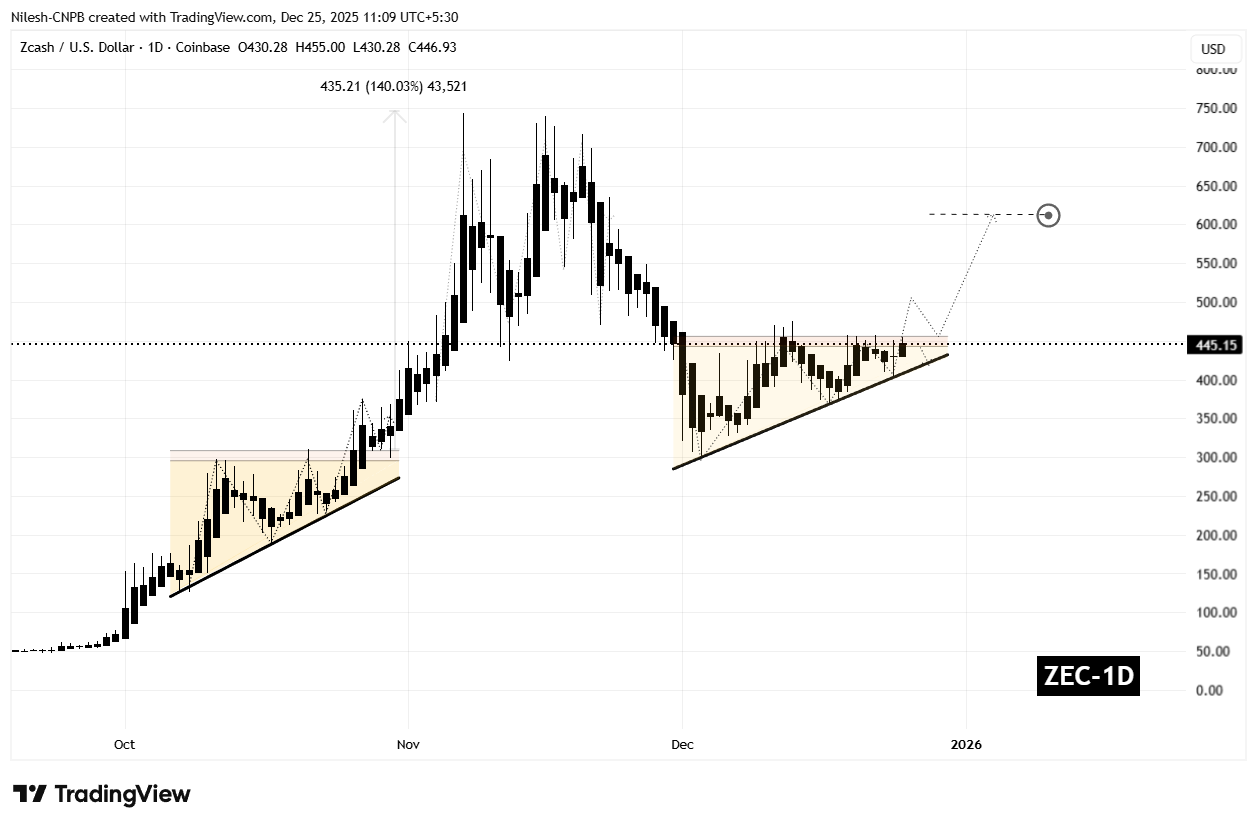
Zcash (ZEC) Daily Chart/Coinsprobe (Source: Tradingview)
Notably, a similar structure played out in October, when ZEC broke out of a comparable consolidation range and surged by an impressive 140%, underscoring the relevance of this pattern in Zcash’s recent price history.
What’s Next for ZEC?
From here, ZEC appears to be gearing up for another test of the neckline resistance between $441 and $457. A confirmed daily close above this zone, particularly if followed by a successful retest as support, would validate the breakout and could trigger a strong bullish expansion.
Based on the measured move of the ascending triangle, the technical upside projection points toward $613, representing a potential 37% upside from current levels. This target also aligns with prior price structure, adding further weight to the bullish scenario.
That said, traders should remain cautious. A failure to break above resistance could send ZEC back toward its rising support line, where the pattern would need to continue holding to preserve the bullish outlook.
For now, the combination of whale accumulation, improving market sentiment, and a tightening bullish structure suggests that Zcash is approaching a critical decision point — one that could define its next major move.
Disclaimer: The views and analysis presented in this article are for informational purposes only and reflect the author’s perspective, not financial advice. Technical patterns and indicators discussed are subject to market volatility and may or may not yield the anticipated results. Investors are advised to exercise caution, conduct independent research, and make decisions aligned with their individual risk tolerance.
Disclaimer: The information on this page may come from third parties and does not represent the views or opinions of Gate. The content displayed on this page is for reference only and does not constitute any financial, investment, or legal advice. Gate does not guarantee the accuracy or completeness of the information and shall not be liable for any losses arising from the use of this information. Virtual asset investments carry high risks and are subject to significant price volatility. You may lose all of your invested principal. Please fully understand the relevant risks and make prudent decisions based on your own financial situation and risk tolerance. For details, please refer to
Disclaimer.
Related Articles
BTC 15-minute rally of 0.85%: Fed policy shift and ETF capital resonance drive buying momentum
From 2026-03-12 09:30 to 2026-03-12 09:45 (UTC), Bitcoin (BTC) experienced a rapid surge within a 0.93% volatility range, achieving a return of +0.85%, with prices fluctuating between 69678.0 and 70324.2 USDT. Trading volume increased approximately 38% compared to the previous hourly average. Market attention surged significantly, with short-term bullish sentiment amplified notably.
The primary driver of this market movement was the Federal Reserve Chair's early morning release of policy shift signals, hinting that the pace of future rate hikes may slow down. The market broadly interpreted this as a marginal improvement in the liquidity environment
GateNews44m ago
PI Token Maintains Bullish Trend as Anticipation for Pi Day Grows
PI token trades above $0.21 after rallying over 25% in the past 7 days as anticipation for the upcoming Pi Day on March 14 grows.
PiScan recorded 3 million PI deposits to exchanges in 24 hours, suggesting near-term profit taking which could reverse the bullish trend.
Pi Network’s PI token tr
CryptoNewsFlash50m ago
Why Didn't BTC Drop During Geopolitical Conflicts? Answers From Binance's Fund Structure and CVD
The article analyzes the relationship between Binance's BTC balance changes and market demand, indicating that the decrease in BTC balances in the short term is related to genuine demand, especially during the US-Iran conflict. The widening gap in spot trading volume suggests active buying activity, supporting the presence of real demand. Although short-term demand may stabilize BTC prices, the long-term trend still leans downward, and the process of demand recovery could be lengthy.
PANews51m ago
Glassnode Data: Most XRP Supply in Loss, What It Means for Investors
Glassnode data shows 36.8 billion XRP, nearly 60% of the circulating supply, is held at a loss, with unrealized losses reaching $50.8 billion.
XRP traded near $1.34, while futures volume jumped on BitMEX and Binance as ETF outflows and weak spot activity kept pressure on price.
Glassnode dat
CryptoNewsFlash1h ago
23.38% Surge for OGN: What It Means for Investors
OGN's price surged 23.38% in 15 minutes, currently at $0.03356, driven by robust trading volume and market activity. Analysts cite macroeconomic factors and regulatory news influencing investor sentiment, while traders monitor key resistance and support levels.
Coinfomania1h ago
Bitcoin Supply Shock Imminent? Whale Holdings in Dormancy, Retail Selling Intensifies Price Volatility
The Bitcoin market is undergoing structural changes, with short-term holders selling off due to financial pressures, while long-term investors remain dormant, indicating potential supply shocks. Currently, Bitcoin is priced at $69,446, and although some holdings are at a loss, the stability of long-term holders could support the market. Analysts advise paying attention to on-chain indicators and whale activity to evaluate future price trends and liquidity risks.
GateNews1h ago