
Date: Tue, Dec 23, 2025 | 06:01 PM GMT
The broader cryptocurrency market has remained under pressure over the past several weeks, with the ongoing corrective phase weighing heavily on overall altcoin sentiment. Monad (MON) has also felt the impact of this weakness, as persistent selling pressure has kept price action subdued and volatile.
MON has declined by nearly 32% over the past 30 days, yet a closer look at the chart suggests that the current structure may be more constructive than it appears at first glance. Interestingly, Monad’s recent price behavior is beginning to resemble a bottoming pattern that previously played out on Hyperliquid (HYPE), a setup that eventually led to a powerful upside reversal earlier this year.
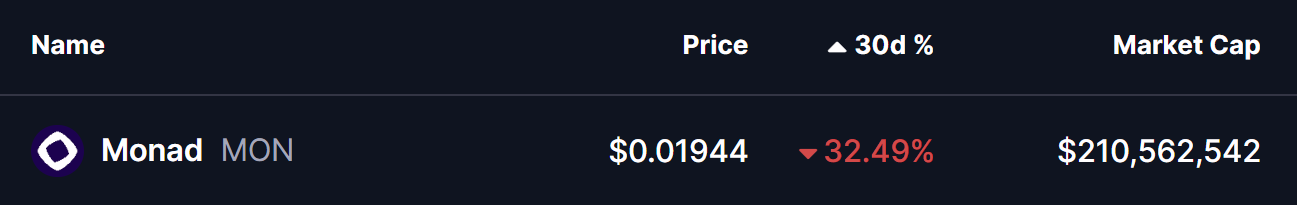
Source: Coinmarketcap
MON Mirrors HYPE’s Fractal Structure
On the comparative charts, MON appears to be tracing a structure strikingly similar to HYPE’s April 2025 fractal. In HYPE’s case, the token endured a deep 73% correction from its all-time high before forming a broadening wedge structure near the bottom. That consolidation phase ultimately resolved to the upside, with price reclaiming its key moving average and triggering a rally of more than 160% in the weeks that followed.
Monad’s decline from its own all-time high has reached roughly 65%, placing it well within the range of historical washout zones often associated with trend exhaustion. The current setup shows MON compressing within a symmetrical broadening wedge, a pattern that frequently precedes strong directional moves once price escapes the structure.
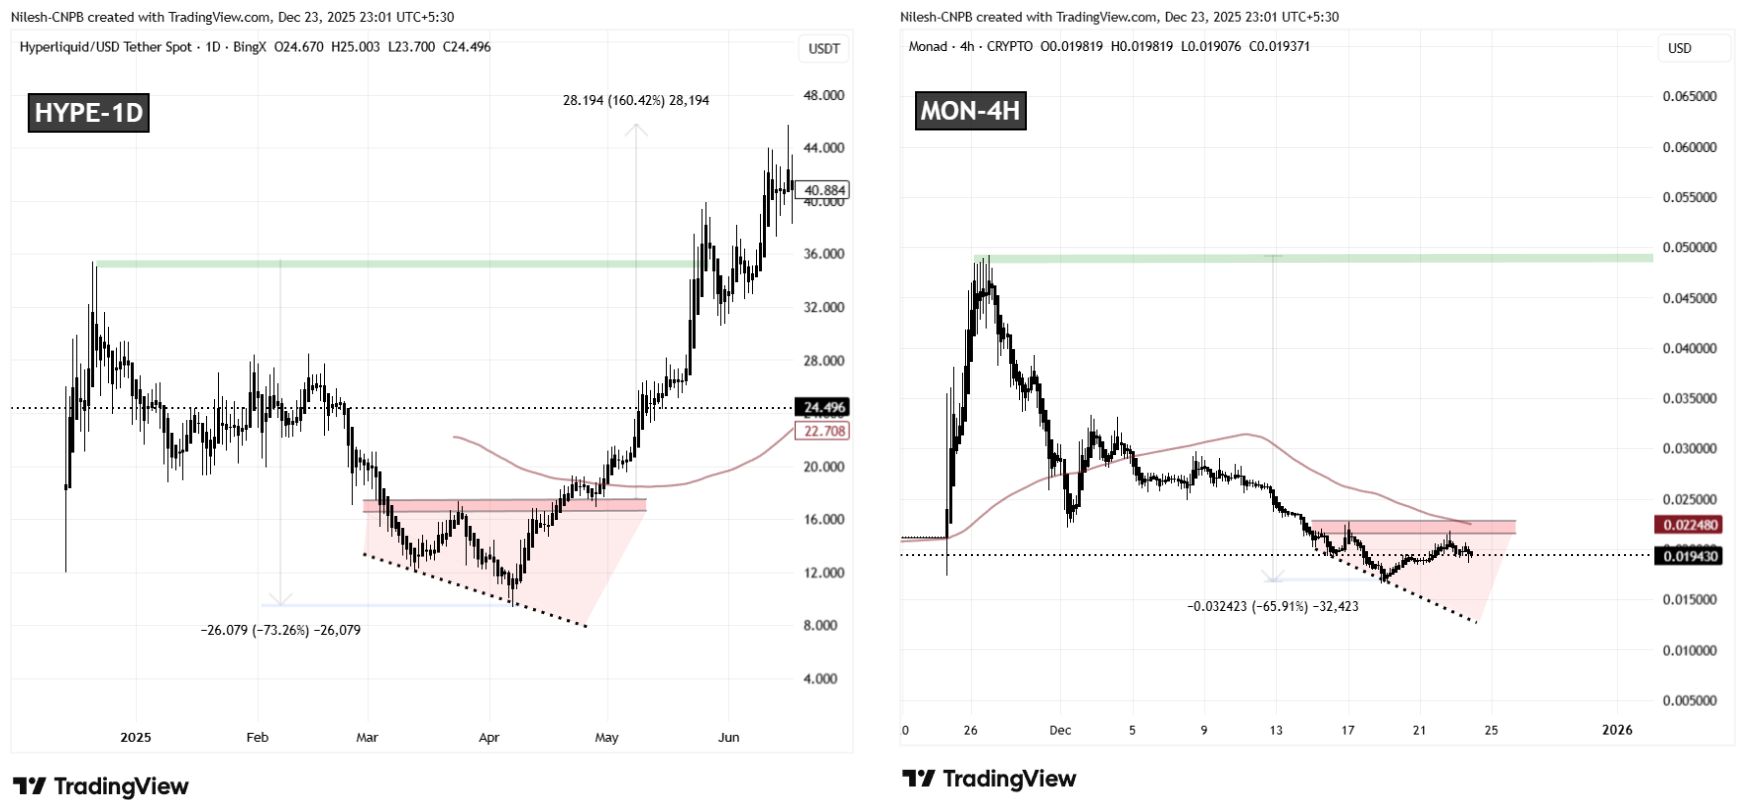
HYPE and MON Fractal Chart/Coinsprobe (Source: Tradingview)
This similarity becomes more compelling when viewed alongside the price behavior around resistance. MON is currently hovering just below a key neckline resistance band between $0.02170 and $0.02268, an area that closely mirrors the zone where HYPE consolidated before its breakout. The alignment between these two structures suggests that MON may be approaching a decision point.
What’s Next for MON?
Despite the growing resemblance to HYPE’s pre-breakout phase, the technical picture has not yet fully shifted in favor of the bulls. Sellers still retain short-term control, and confirmation is needed before a bullish reversal can be considered valid.
For momentum to flip decisively, MON would need to break above the upper boundary of the wedge and reclaim its 100 moving average, which sits near the $0.02248 level. A successful move above this region would signal improving trend strength and increase the probability that the fractal analogy continues to play out.
If such a breakout occurs, the upside potential becomes notable. A sustained bullish reversal could open the door for a broader recovery move toward the $0.049 area, which aligns with MON’s previous all-time high and represents roughly 155% upside from current levels. Until then, price action around resistance will remain critical in determining whether this fractal setup evolves into a full-fledged trend reversal or fails under continued market pressure.
**Disclaimer: **The views and analysis presented in this article are for informational purposes only and reflect the author’s perspective, not financial advice. Technical patterns and indicators discussed are subject to market volatility and may or may not yield the anticipated results. Investors are advised to exercise caution, conduct independent research, and make decisions aligned with their individual risk tolerance.
Disclaimer: The information on this page may come from third parties and does not represent the views or opinions of Gate. The content displayed on this page is for reference only and does not constitute any financial, investment, or legal advice. Gate does not guarantee the accuracy or completeness of the information and shall not be liable for any losses arising from the use of this information. Virtual asset investments carry high risks and are subject to significant price volatility. You may lose all of your invested principal. Please fully understand the relevant risks and make prudent decisions based on your own financial situation and risk tolerance. For details, please refer to
Disclaimer.
Related Articles
BTC 15-minute rise of 0.60%: ETF capital inflows and technical breakout resonance drive short-term momentum
2026-03-13 12:45 to 2026-03-13 13:00 (UTC), BTC achieved a +0.60% return within 15 minutes, with a price range of 72341.6-72888.0 USDT and a volatility amplitude of 0.76%. Short-term price oscillations noticeably intensified. Due to abundant trading volume, market attention rose rapidly, reflecting a phase of strengthened buying power.
The primary drivers of this movement are continuous net inflows into ETFs and a technical breakout of key structures. In March 2026, BTC spot ETFs attracted capital inflows as high as 1.6 billion dollars in a single week.
GateNews15m ago
DeFi enters a "winter of yields": liquidity stagnation, leverage contraction, and the disappearance of arbitrage opportunities
The DeFi market entered an "interest rate winter" since September 2025, with deposit rates for major stablecoins declining sharply and supply-demand imbalances causing liquidity congestion. The rate decline reflects reduced capital demand and a lack of high-return opportunities. Stablecoin lending demand has dropped significantly, with market risk appetite shifting toward more stable investment channels. In response to this situation, the Sky protocol demonstrates competitiveness and adaptability by introducing real-world assets to enhance yields. The low interest rates during this phase can be viewed as an opportunity for DeFi market transformation.
区块客19m ago
"Seeking a Sword by Marking a Boat" - Style Coin Price Predictions Go Viral: The Practical Logic and Flaws of Mystical Prophecies
Author: Frank, PANews
Whenever the market enters a confusing phase of going nowhere, people try to use a "cutting the boat to seek the sword" method of historical retrospection to predict the next market movement. In such cases, people often see from these theories and charts that history always repeats itself, and seem to automatically overlay and verify future price movements with a certain period in the past.
This coincidence seems to have a magical effect and is often verified. Some bloggers claim this prediction method has an accuracy rate of 75%~80%.
Does this "cutting the boat to seek the sword" style price prediction that repeatedly goes viral on social media help the market identify stages, or is it just packaging noise as prophecy?
From "Tick Fractals" to "History Rhyming"
The peak operation regarding predictions of October 2025 market tops is an analyst named CryptoBullet, who created a method called "ti
区块客23m ago
Surviving Oscillating Markets: How Retail Investors Can Minimize Losses? Capital Flow Trends and Practical Guide
Author: MyToken
In the crypto market, sentiment often emerges more easily than logic. When "volatility" becomes the norm for the broader market and "anxiety" becomes the prevailing mindset among retail investors, a discussion on how to "lose less money" carries more practical significance than any macro narrative presentation.
Recently, the renowned data aggregation platform MyToken hosted an AMA event themed "In the Current Market, How Can Retail Investors Lose Less Money? Capital Flow and Practical Guide." The event invited independent trader BTC Bull Demon King and KTX Exchange CMO Christine, who provided puzzled investors with a practical "survival guide" from the perspectives of independent traders and trading platforms respectively.
Below is a highlight recap of this AMA.
---
Market Phase Consensus: Stop Fantasizing About a Bull Run, This is a "Consolidation Phase"
Market positioning is a relatively important issue, as it directly determines the next
PANews1h ago
NAV Price Surges 44.25%: Is a New Trend Emerging?
NAV coin recently surged by 44.25%, reaching $0.032715, amid increased trading activity and fluctuating market conditions. Analysts attribute this rally to rising on-chain activity and shifting sentiment toward altcoins, while traders monitor key price levels for future movements.
Coinfomania3h ago
Why TARA Just Skyrocketed 24.47% in 60 Minutes
TARA's price surged 24.47% to $0.000047 amid mixed signals in the crypto market and increased trading activity. Market conditions and macroeconomic factors are influencing investor sentiment, with traders closely monitoring key resistance and support levels.
Coinfomania3h ago