Date: Sat, Dec 20 2025 | 05:55 PM GMT
The broader cryptocurrency market has continued to struggle with uneven and choppy price action over the past several weeks, a phase that began after the sharp sell-off on October 10. That correction pushed Ethereum (ETH) lower by nearly 26% over the last 60 days, keeping sustained pressure across the altcoin market. Worldcoin (WLD) has been no exception, remaining under heavy selling pressure during this period.
WLD is down more than 44% over the past two months. While the short-term trend still leans bearish, the higher-timeframe chart is starting to show a structure that often appears near potential market turning points. If key technical levels are reclaimed, the current setup could evolve into a broader recovery attempt.
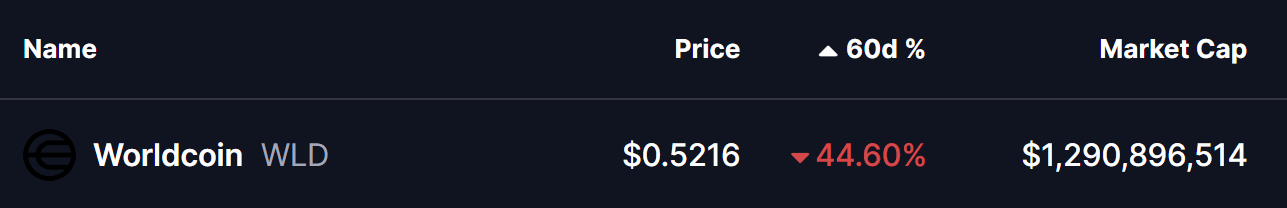
Source: Coinmarketcap
Power of 3 Pattern in Focus
On the higher-timeframe chart, WLD appears to be forming a classic Power of 3 structure, a pattern frequently associated with market cycle lows and trend transitions. This structure typically unfolds in three stages—accumulation, manipulation, and expansion—with the most decisive move usually emerging once the final phase begins.
Earlier, WLD spent an extended period moving sideways within a well-defined range between $0.6528 and $0.5628. This low-volatility environment, highlighted by the grey box on the chart, reflects the accumulation phase. During such phases, price action tightens, volatility fades, and longer-term participants often begin positioning quietly while broader sentiment remains weak or indifferent.
That stability eventually gave way as broader market pressure intensified. WLD broke below the $0.5628 support and slid to a recent low near $0.4721 before attempting a modest rebound. This sharp downside move aligns closely with the manipulation phase of the Power of 3 pattern. Such breakdowns are often designed to trigger stop-losses and force capitulation, shaking out weaker holders before price looks for a base.
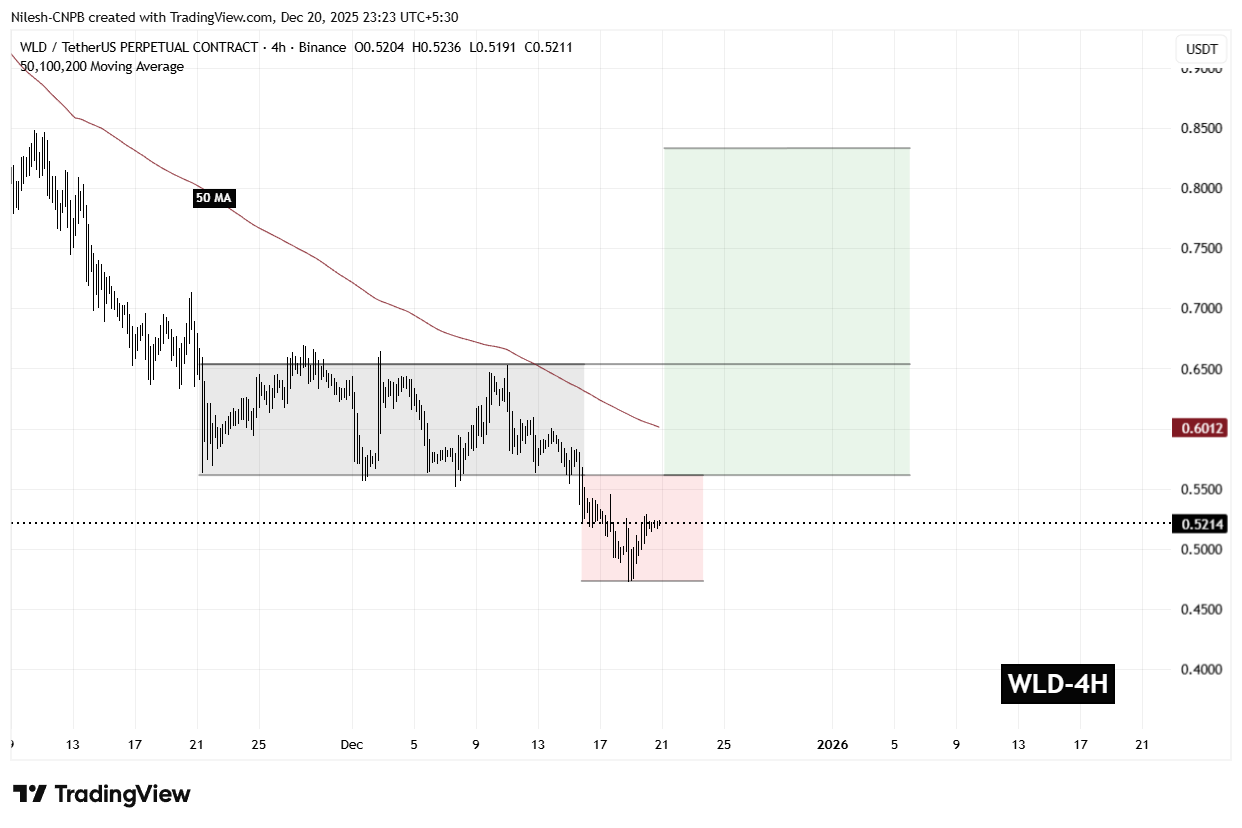
Worldcoin (WLD) 4H Chart/Coinsprobe (Source: Tradingview)
Notably, selling momentum has started to slow near this lower zone. Recent candles show reduced downside follow-through, suggesting that bearish pressure may be losing strength as price consolidates after the breakdown.
What’s Next for WLD?
At the time of writing, WLD continues to trade within the broader manipulation zone, which calls for caution. Price remains below the 50-period moving average near $0.6012, an area that now acts as an important short-term resistance. A sustained move back above this level would be an early signal that sellers are losing control.
For the bullish scenario to gain traction, WLD needs to reclaim both the $0.5628 level and establish acceptance above the $0.60–$0.65 resistance zone. A successful recovery into this former range would suggest that the manipulation phase has likely concluded and that the market may be transitioning toward the expansion phase of the structure.
If buyers manage to break and hold above $0.6528, the chart projection opens the door for a move toward the $0.83 region, which represents the measured expansion target and implies a potential upside of roughly 59% from current levels.
That said, this setup remains conditional. As long as WLD trades below $0.5628, downside risks cannot be ruled out, and the market remains vulnerable to further volatility. Holding recent lows and reclaiming key resistance levels will be critical for bulls looking to validate a bullish reversal narrative.
Disclaimer: The views and analysis presented in this article are for informational purposes only and reflect the author’s perspective, not financial advice. Technical patterns and indicators discussed are subject to market volatility and may or may not yield the anticipated results. Investors are advised to exercise caution, conduct independent research, and make decisions aligned with their individual risk tolerance.
Disclaimer: The information on this page may come from third parties and does not represent the views or opinions of Gate. The content displayed on this page is for reference only and does not constitute any financial, investment, or legal advice. Gate does not guarantee the accuracy or completeness of the information and shall not be liable for any losses arising from the use of this information. Virtual asset investments carry high risks and are subject to significant price volatility. You may lose all of your invested principal. Please fully understand the relevant risks and make prudent decisions based on your own financial situation and risk tolerance. For details, please refer to
Disclaimer.
Related Articles
WIF Bulls Eye $0.21 After Strong Reaction at Major Support
WIF trades near $0.17 as buyers defend critical support around $0.16.
Oversold indicators hint at potential rebound toward $0.21 resistance.
Breakdown below $0.16 could push price toward $0.15 support.
Dogwifhat — WIF, has faced pressure in recent trading sessions, yet market attention r
CryptoNewsLand16m ago
Supported by ETF fund inflows, Bitcoin shows "strong" rebound near $72,800
Under the influence of capital inflows into U.S. spot cryptocurrency ETFs, Bitcoin prices stabilized last week and touched a high of 73,927 USD, with gains of approximately 6% to 7%. Ethereum also rebounded, indicating a recovery in market risk appetite. ETF capital inflows became the main support factor. Despite volatility in macroeconomic market sentiment, reassuring commentary on inflation and oil price risks helped stabilize prices.
区块客31m ago
Bitcoin Breaks Through $74,000 Resistance Level, Crypto Market Strengthens Collectively, ETH and SOL Lead Weekly Gains
On March 16, the crypto market continued to rise, with Bitcoin surpassing $74,000, up 2.9% in 24 hours. Ethereum and Solana showed larger gains, indicating capital flowing toward higher-risk crypto assets. An improving macroeconomic environment provided market support, with falling oil prices and a weakening dollar aiding liquidity release. The market is focused on the upcoming Federal Reserve meeting, which could impact future interest rate expectations.
GateNews40m ago
Bitcoin Breaks Above 50-Day Moving Average Approaching $74,000, BTC Upward Momentum Strengthens But $75,000 May Become Key Resistance Level
Bitcoin's price surged over 3% on March 16, reclaiming the 50-day moving average and breaking through $71,125, indicating strengthened market momentum. Despite external uncertainties, Bitcoin demonstrated resilience and gradually recovered above the $70,000 level. Analysts noted that stabilization above the 50-day moving average may signal a trend reversal, but technical breakthroughs don't necessarily guarantee long-term gains. The market is watching whether Bitcoin can break through $75,000, with trading volume and capital inflows being key factors.
GateNews45m ago
Bitcoin Breaks Through $73,000! Outperforms Gold Amid US-Iran War, EF Sells 10.2 Million ETH
Bitcoin recently broke through $73,000 with strong performance, decoupling from tech stocks and gold. Analysts predict that if the market stabilizes, it could rise to $75,000 to $80,000. However, geopolitical risks and extremely fearful market sentiment continue to pressure prices. Meanwhile, the Ethereum Foundation sold Ether for approximately $10.2 million to maintain operations.
CryptoCity1h ago