Date: Sat, Dec 20 2025 | 10:55 AM GMT
The broader cryptocurrency market has remained locked in choppy price action over the past several weeks, a phase that began after the sharp sell-off on October 10. That correction pulled Ethereum (ETH) lower by nearly 23% over the last 60 days, keeping consistent downside pressure on major altcoins. **Arbitrum (ARB) **has been caught in the same wave of weakness, struggling to regain bullish momentum.
ARB has fallen by more than 38% over the past two months. While the short-term trend still points lower, the higher-timeframe chart is starting to reveal a structure that often appears near market turning points. If key levels are reclaimed, this setup could open the door for a meaningful recovery.
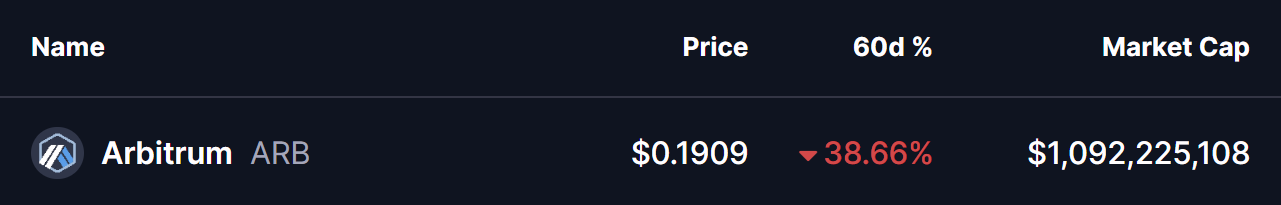
Source: Coinmarketcap
Power of 3 Pattern in Focus
On the higher-timeframe chart, ARB appears to be developing a classic Power of 3 formation, a pattern commonly linked to market cycle lows and trend transitions. This structure typically unfolds in three phases: accumulation, manipulation, and expansion, with the strongest directional move often emerging once the final phase begins.
Earlier, ARB spent an extended period moving sideways within a clearly defined range between $0.2250 and $0.1914. This low-volatility environment, highlighted by the grey box on the chart, represents the accumulation phase. During such phases, selling pressure eases and longer-term participants often begin positioning quietly while broader market sentiment remains cautious.
That calm structure eventually broke down as the broader market weakened. ARB slipped decisively below the $0.1914 support and dropped to a local low near $0.1721 before staging a modest rebound. This sharp move lower aligns closely with the manipulation phase of the Power of 3 pattern. Such breakdowns are frequently designed to trigger stop-losses and force capitulation, flushing out weaker hands before price attempts to stabilize.
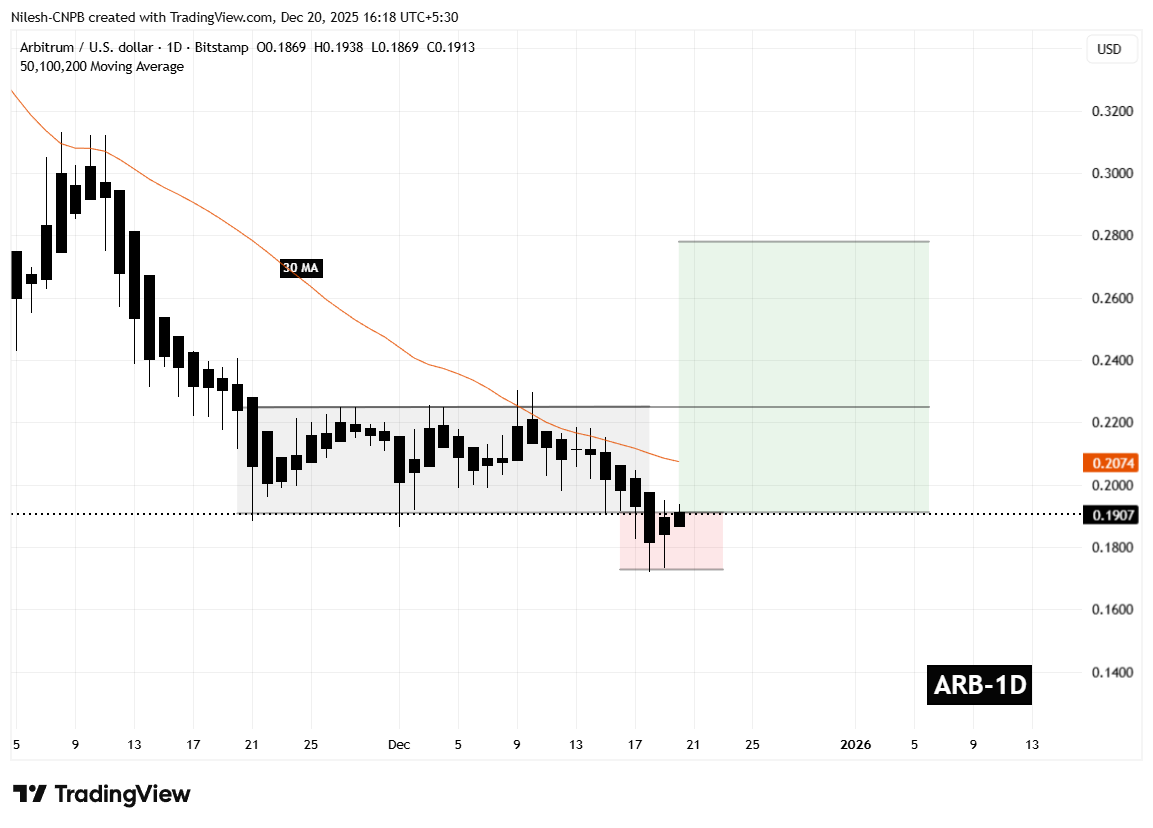
Arbitrum (ARB) Daily Chart/Coinsprobe (Source: Tradingview)
Notably, selling pressure has begun to cool around this lower zone. Recent candles show reduced downside follow-through, suggesting that bearish momentum may be losing strength as price probes for a base.
What’s Next for ARB?
At the time of writing, ARB is trading just below the lower boundary of its former range, near $0.1907. Price also remains below the 30-period moving average around $0.2074, which is currently acting as a key short-term resistance. This keeps the broader setup in a wait-and-see phase.
For the bullish case to gain traction, ARB needs to reclaim both the $0.1914 level and push back above the moving average. A sustained recovery above these levels would signal that the manipulation phase has likely ended and that the expansion phase of the Power of 3 structure may be getting underway.
If buyers manage to break and hold above the $0.2250 resistance, the chart projection points toward a potential move into the $0.2779 region. This level aligns with prior structural resistance and represents an upside of roughly 45% from current prices.
However, this setup remains conditional. As long as ARB continues to trade below the $0.2074 resistance, downside risks cannot be ruled out, and the market remains vulnerable to further volatility. Holding recent lows and reclaiming key resistance levels will be critical for bulls looking to validate a bullish reversal narrative.
Disclaimer: The views and analysis presented in this article are for informational purposes only and reflect the author’s perspective, not financial advice. Technical patterns and indicators discussed are subject to market volatility and may or may not yield the anticipated results. Investors are advised to exercise caution, conduct independent research, and make decisions aligned with their individual risk tolerance.
Disclaimer: The information on this page may come from third parties and does not represent the views or opinions of Gate. The content displayed on this page is for reference only and does not constitute any financial, investment, or legal advice. Gate does not guarantee the accuracy or completeness of the information and shall not be liable for any losses arising from the use of this information. Virtual asset investments carry high risks and are subject to significant price volatility. You may lose all of your invested principal. Please fully understand the relevant risks and make prudent decisions based on your own financial situation and risk tolerance. For details, please refer to
Disclaimer.
Related Articles
Whales holding between 10 and 10,000 BTC increased their holdings, accounting for 68.17% of the total supply.
Santiment report shows that investors holding 10 to 10,000 bitcoins have increased, now controlling 68.17% of the supply. Bitcoin is performing strongly relative to the S&P 500, showing signs of a positive reversal. The S&P 500 has declined 2.2%, while Bitcoin has risen 2.4%.
GateNews48m ago
SHIB Derivatives See 1,549% Jump in Netflows: Is Short Squeeze Brewing? - U.Today
Shiba Inu (SHIB) experienced a 1,549% increase in futures netflows as traders adjusted their positions, with inflows surpassing outflows. Despite a recent price drop, positive on-chain indicators suggest potential for a market rebound if buyers return.
UToday2h ago
鏈上熱到爆、以太幣卻漲不動?專家揭「致命死穴」:恐下探 1,500 美元
CryptoQuant 報告指出,以太坊面臨「採用悖論」,雖然網路活躍度創新高,但幣價卻下滑。若熊市持續,到第三季末以太幣可能跌至 1,500 美元。智能合約活躍度上升與以太幣價格脫鉤,交易所流入量更能反映價格動態。投資需求疲軟,資金持續流失是主要隱憂。
区块客2h ago
英國前首相喊:比特幣是龐氏騙局,川普次子 Eric Trump、Michael Saylor 強力反駁
前英國首相波里斯·強森在《每日郵報》指控比特幣為「龐氏騙局」,引發加密界人士如Eric Trump和Michael Saylor的反擊,強調比特幣的去中心化特性及其正當性。比特幣近期交易價格也突破7.1萬美元。
動區BlockTempo2h ago
彭博社:比特币接近历史级熊市底部,4.5万至5.5万美元或为最终底部区间
彭博社分析认为,比特币接近历史熊市底部,预计4.5万至5.5万美元为最终底部。分析指出,长期技术指标显示比特币低估,市场流动性和成熟度的提升使历史熊市的跌幅逐渐缩小。
GateNews3h ago
今日加密货币恐慌与贪婪指数降至15,市场处于极度恐慌状态
Gate News 消息,3月15日,据 Alternative.me 数据显示,今日加密货币恐慌与贪婪指数降至15,较昨日的16进一步下滑,市场持续处于「极度恐慌状态」。
GateNews5h ago