The price of Hedera (HBAR) continues to face strong pressure as the entire crypto market is encountering a weakening trend, exacerbating recent losses. After several unsuccessful attempts to bounce back, HBAR still maintains a downward trend, reflecting the cautious sentiment of investors.
This adjustment is further amplified by the drop in demand, as data from ETF funds shows that interest in HBAR from both the crypto market and traditional finance is at a very low level.
Hedera ETF has not gained traction
Throughout 2024 and into 2025, spot crypto ETFs have become the focal point of the market. Many major altcoins are expected to follow in the footsteps of Bitcoin and Ethereum by entering the ETF arena. Hedera was once considered a potential candidate due to its strong business relationships and regulatory compliance positioning.
However, the reality is not as expected. Less than two months after its launch, the Canary HBAR ETF recorded an inflow of zero on December 22nd. This data shows that interest in HBAR is extremely limited both in the crypto market and in traditional financial channels, thereby further weakening investor sentiment.
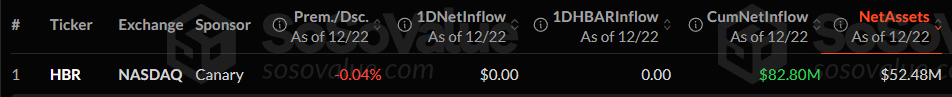 ETF capital flow HBAR | Source: SoSoValueThe lack of capital inflow into the ETF has removed an important bullish catalyst for HBAR. Without the participation of large institutions, HBAR lacks sufficient support against increasing selling pressure. This development further reinforces concerns that the previous wave of optimism about the ETF was merely speculative, lacking backing from substantial capital.
Technical indicators are also sending negative signals. The On-Balance Volume index (OBV) has fallen to its lowest level in nine months, indicating that the distribution process is still occurring strongly. OBV is a measure of whether trading volume leans towards buying or selling.
In the case of HBAR, the OBV continuously falling confirms that selling pressure is dominating recent trading sessions.
The downward OBV line indicates that the trading volume on down days significantly exceeds that on up days, reflecting decisiveness from the selling side. When the price decline is supported by large volume, the likelihood of a reversal will be very low unless a clear buying momentum appears.
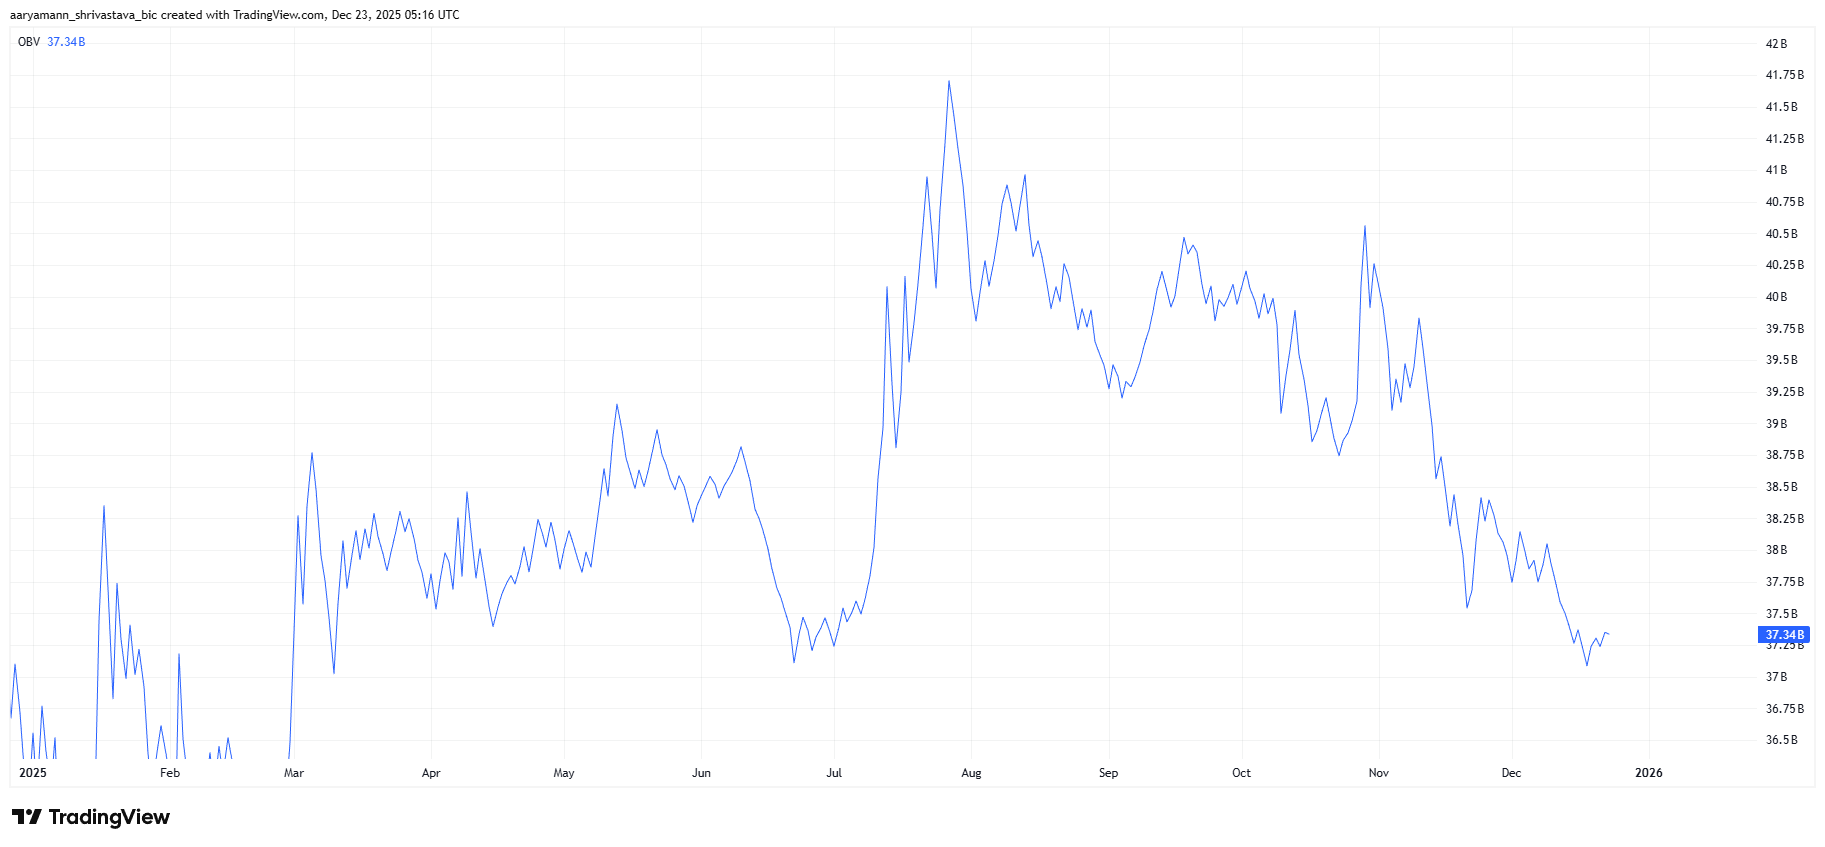 The OBV index of HBAR | Source: TradingViewFor HBAR, the trend of OBV is completely in line with the general downtrend. The selling pressure is structural, not just a temporary phenomenon. Until trading volume stabilizes or turns positive, the downside risk remains high despite occasional short-term accumulation.
The fall trend of HBAR may last
Currently, HBAR is trading around $0.111, still below the resistance level of $0.120. This token has maintained a downward trend for more than six consecutive weeks. In the current context, regaining this price range is very difficult without an improvement in demand or market sentiment.
If selling pressure continues to increase, HBAR risks losing the support level of $0.110. A clear breakout could push the price down to the $0.099 range, prolonging the downtrend and reinforcing the downward momentum, increasing the risk of further losses.
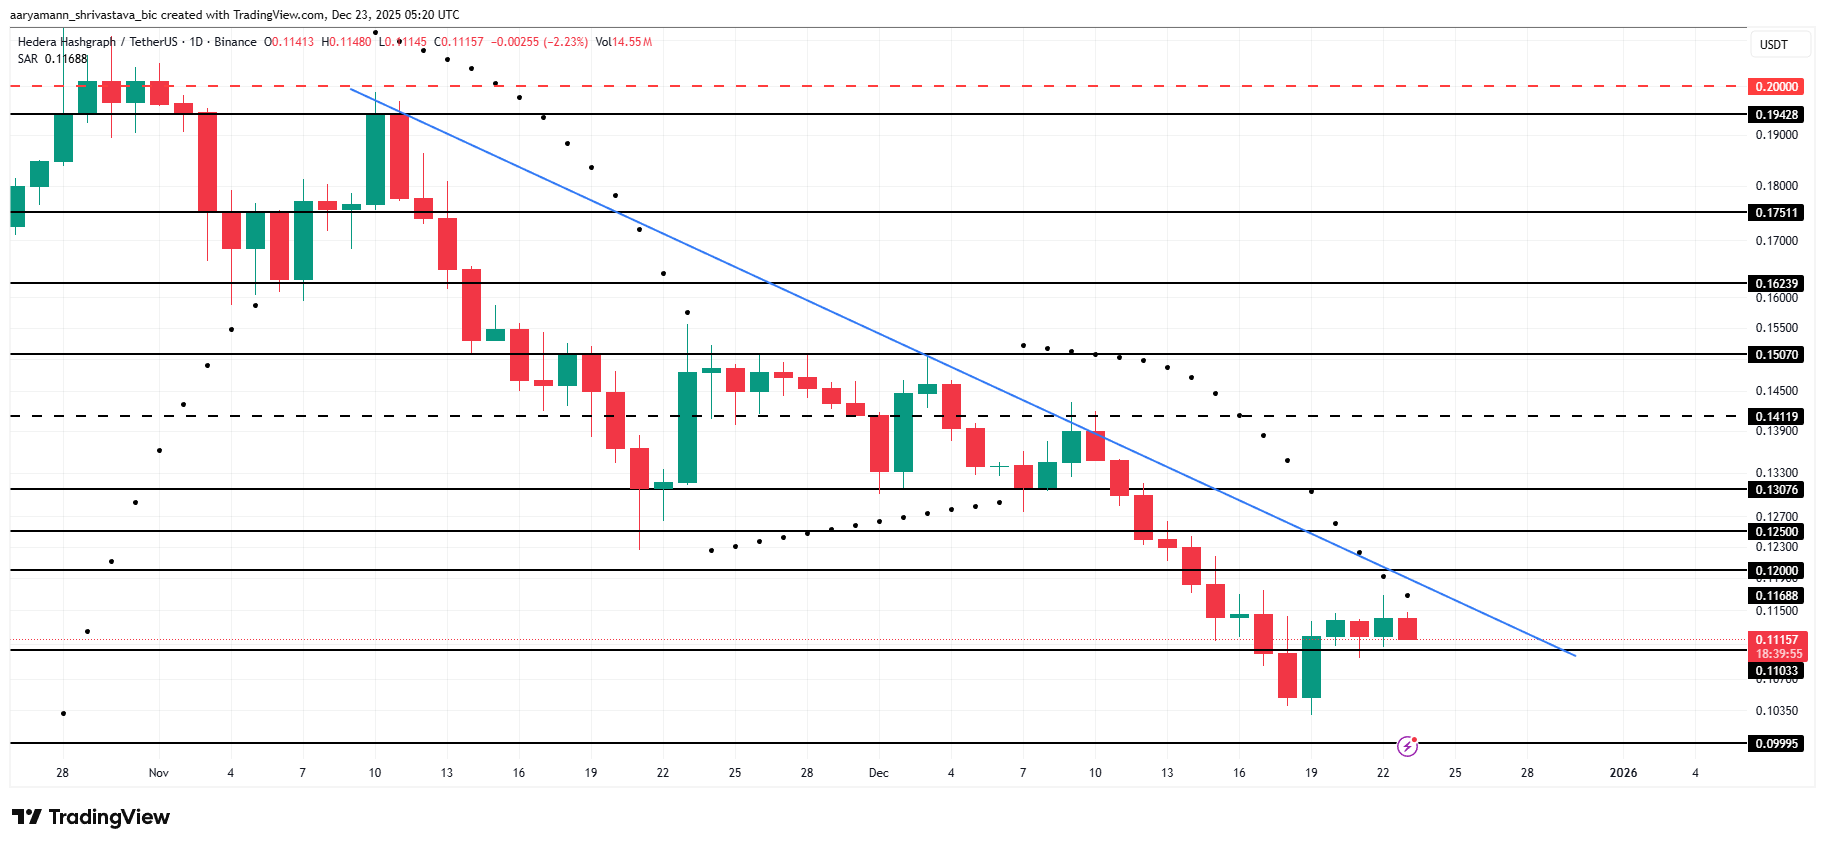 HBAR price analysis | Source: TradingViewHowever, stability may still emerge if market conditions improve even slightly. Holding above the $0.110 threshold will open up opportunities for HBAR to move sideways and gradually escape the bearish structure. Even if it cannot surpass the $0.120 mark, a sustainable accumulation process will weaken the “deep fall” argument and reduce short-term risks.
Mr. Teacher
Disclaimer: The information on this page may come from third parties and does not represent the views or opinions of Gate. The content displayed on this page is for reference only and does not constitute any financial, investment, or legal advice. Gate does not guarantee the accuracy or completeness of the information and shall not be liable for any losses arising from the use of this information. Virtual asset investments carry high risks and are subject to significant price volatility. You may lose all of your invested principal. Please fully understand the relevant risks and make prudent decisions based on your own financial situation and risk tolerance. For details, please refer to
Disclaimer.
Related Articles
Bitcoin Cash Battles $459 Resistance as Massive Sell Walls Stack Toward $650
BCH is trading at $455.86 close to the resistance range of $459.20 with the support level of $447.44.
The chart data indicates that the chart has strong resistance levels at around $520, $580 and $650 which restricts the momentum on short term upside.
Following a sharp fall, price
CryptoNewsLand30m ago
PEPE Consolidates Above $0.05324 Support as Momentum Strengthens and Resistance Near $0.05336 Holds
PEPE has a tight intraday price compression with a support level of $0.053243 and resistance level of $0.053363.
A RSI of 64.13 represents the moderate bullish momentum whereas MACD history is slightly positive, which indicates the gradual buying momentum.
The price is at $0.053364
CryptoNewsLand1h ago
HYPE Hits $35.53 After 2.4% Jump — Will Momentum Hold as Price Tests $35.59 Resistance?
Hyperliquid’s HYPE trades at $35.53, approaching the $35.59 resistance after a 2.4% daily gain.
The chart shows the $33.67 zone acting as support after price moved above a previously contested level.
Price now trades between $33.67 support and $35.59 resistance, shaping the immediate
CryptoNewsLand1h ago
Cardano áp sát mốc 0,28 USD khi lực mua nhỏ lẻ tăng mạnh – Đà bứt phá đã cận kề?
The current price of Cardano (ADA) is around $0.270, having risen from a support level of $0.254-$0.260. It underwent a dip to $0.2194 before buyers returned, leading to a structure indicating accumulation. The price tests resistance at $0.287, while whale activity raises market uncertainty. Despite a reduction in ADA holdings among large wallets, the supply remains concentrated in their hands, suggesting strategic liquidity reallocation rather than widespread selling. Meanwhile, retail investors continue accumulating ADA.
TapChiBitcoin3h ago
Bitcoin MVRV Z-Score Drops Below 1 Again
The MVRV Z-Score is a key on-chain indicator for assessing Bitcoin's value by comparing market and realized capitalizations. Historical data shows that when the score drops below 1, it often signals significant market recovery. However, changing market dynamics and institutional influences may alter future patterns.
Coinfomania4h ago
「刻舟求劍」式幣價預測走紅,玄學預言的實戰邏輯與缺陷
作者:Frank,PANews
每當市場進入不上不下的迷惘階段,就會有人試圖用「刻舟求劍」式的歷史回溯方法去預測下一段走勢。在這種情況下,人們往往能從這些理論和圖表中看到歷史總是在重演,並似乎自動將未來一段時間的行情走勢與過去的某一段進行重疊驗證。
這種重合似乎有著神奇的效果,也常常被驗證。有部落客自稱這種預測的準確率能到達 75%~80% 。
這種在社群媒體上屢屢爆紅的「刻舟求劍」式價格預測,究竟是在幫助市場識別階段,還是在把噪音包裝成預言?
從「滴答分形」到「歷史押韻」
關於 2025 年 10 月市場頂點預測的巔峰操作是名為 CryptoBullet 的分析師,他所創建的一種名為「ti
区块客5h ago